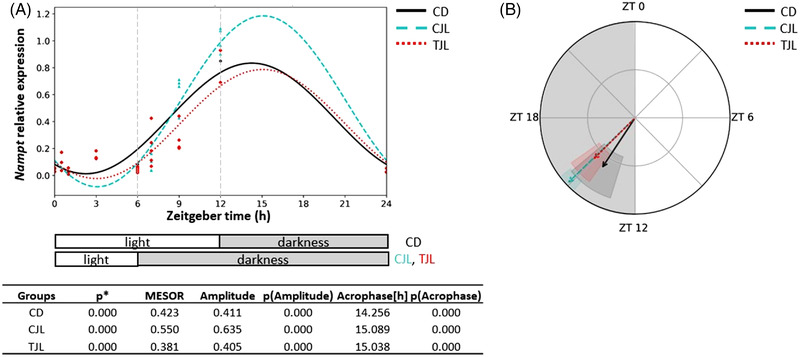
Figure 5.

Estimated circadian rhythm of hepatic Nampt expression of the three animal groups analyzed by Cosinor method. A) Estimated circadian rhythm and rhythmometric parameters. B) Representation of the acrophases and the amplitude of the estimated rhythm. Control day group (CD group): animals housed at 12 h light/dark cycle, administered water (ZT0), and sacrificed at ZT0, 0.5, 1, 3, 6, 12, 13, 15, 18, and 24 h; Control jet lag group (CJL group): animals housed at 12 h light/dark cycle, administered water at ZT6 and immediately moved to dark and sacrificed at ZT6, 7, 9, and 12. Treatment jet lag group (TJL group): animals housed at 12 h light/dark cycle, administered GSPE (250 mg kg−1 bw) at ZT6 and immediately moved to dark and sacrificed at ZT6, 7, 9, and 12. *p ≤ 0.05 indicates circadian rhythm. Acrophase: time at which the peak of a rhythm occurs ([h]. hours); Amplitude: difference between the peak and the mean value of a wave; MESOR: a circadian rhythm‐adjusted mean. p < 0.05 indicates significant differences.
