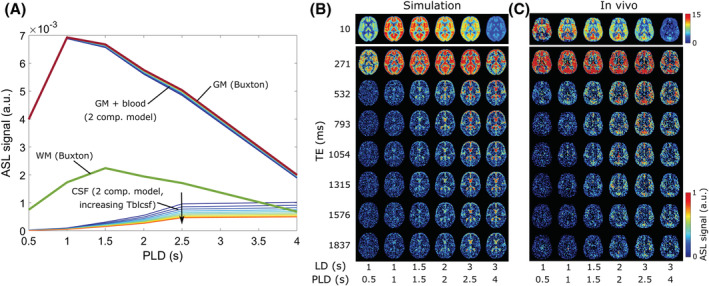
FIGURE 2.

Results of the simulated data. A, Pure GM and WM (bold lines) and CSF signals. GM and WM values are obtained from Buxton modeling. Thin lines represent either the GM + blood or CSF compartment signal obtained from the two‐compartment dynamic model for 10 different values of T bl→CSF (increasing from dark blue to red). All signals are modeled for TE = 0 ms. B, Resulting signal maps in a single slice. C, The corresponding in vivo data from a single subject.
