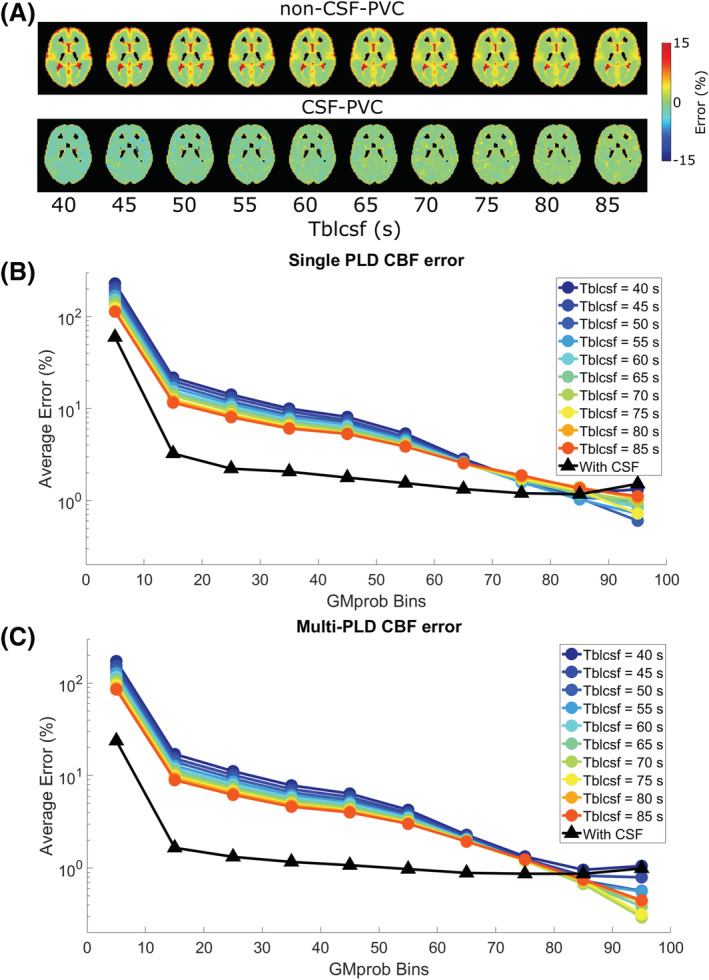
FIGURE 5.

Relative error on CBF quantification with two methods in the simulated dataset. A, B, CBF quantified with a single LD/PLD of 2/2 s. Error is shown as maps (A) and averages over ROIs (B, C, ROIs from Figure 4A). C, CBF quantified by fitting signal from all time points to a Buxton model.
