FIGURE 8.

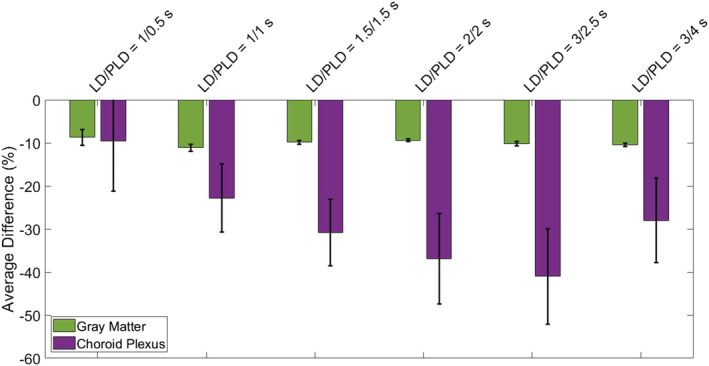
Differences between CSF‐PVC and non‐CSF‐PVC, averaged over all voxels of a GM ROI in a single slice high in the brain, and the choroid plexus ROI. The error bars represent the standard error of the mean over all subjects.

Differences between CSF‐PVC and non‐CSF‐PVC, averaged over all voxels of a GM ROI in a single slice high in the brain, and the choroid plexus ROI. The error bars represent the standard error of the mean over all subjects.