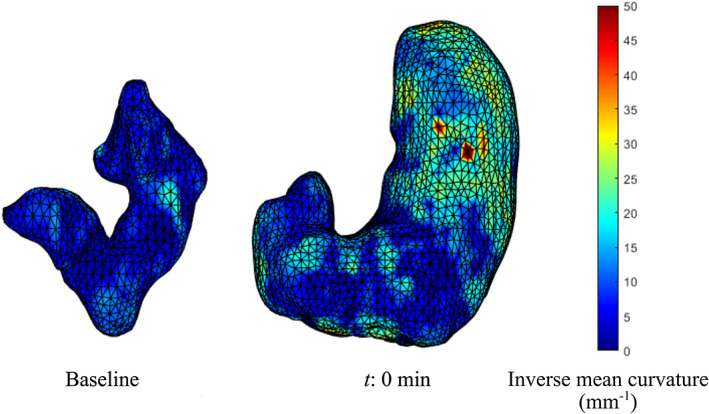
FIGURE 3.

Tension distribution. The image shows an example of an empty stomach at baseline, characterized by lower wall tensions (blue color due to low inverse mean curvature values), compared with an image of a full stomach at t:0 min, characterized by higher tensions, particularly in the fundus (yellow/red colors due to high inverse mean curvature values).
