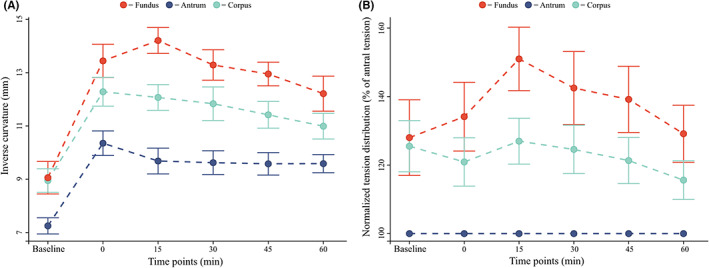
FIGURE 6.

Inverse curvature data. (A) the non‐normalized values of fundus (red), corpus (teal), and antrum mean inverse curvature value (blue) are shown. (B) fundus (red) and corpus (teal) inverse curvatures are shown normalized to antral (blue) values at the same timepoint.
