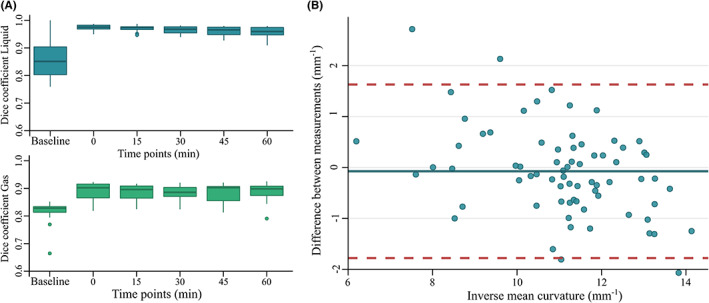
FIGURE 7.

Dice similarity coefficient and intraclass correlation coefficient data. (A) Dice similarity coefficients for the liquid (blue) and gas (green) volumes are shown. (B) Bland–Altman plot for the correlation agreement between the two inverse curvature datasets across every timepoint. Blue dots: Observations, blue line: Bias, red dashed lines: 95% limits of agreement.
