FIGURE B2.

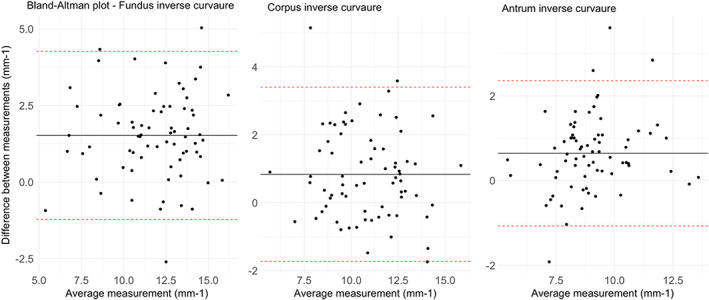
Inverse curvature ICC. Figure shows Bland–Altman plots for each gastric compartment. Data are reported as mm−1. Data show a bias of +1.51 cm2 for fundus data, +0.83 cm2 for corpus, and +0.64 cm2 for antrum.

Inverse curvature ICC. Figure shows Bland–Altman plots for each gastric compartment. Data are reported as mm−1. Data show a bias of +1.51 cm2 for fundus data, +0.83 cm2 for corpus, and +0.64 cm2 for antrum.