Figure 1.
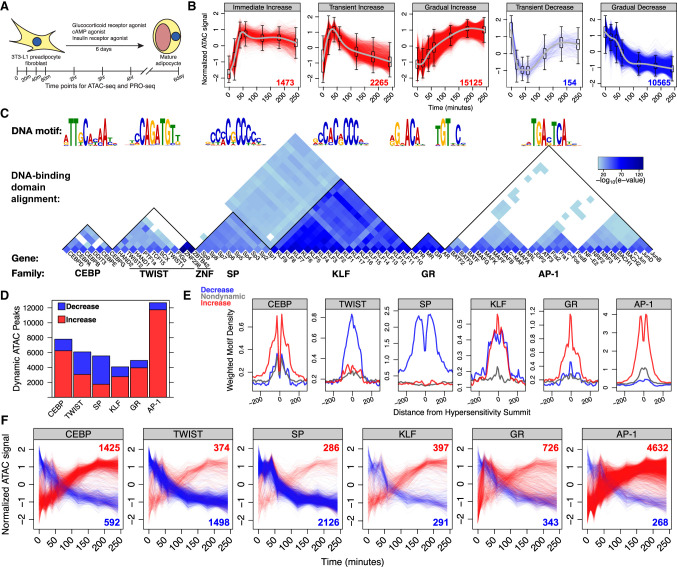
CEBP, TWIST, SP, KLF, GR, and AP-1 TF families drive either increased or decreased chromatin accessibility in adipogenesis. (A) Preadipocyte fibroblast 3T3-L1 cells were treated with an adipogenesis cocktail and harvested at the indicated time points for ATAC-seq and PRO-seq experiments. (B) Temporal classification of ATAC-seq peaks revealed five major dynamic classes. Each dynamic ATAC peak is a red or blue trace with the number of peaks in the class indicated in the lower right; the x-axis represents time, and the y-axis indicates normalized accessibility. (C) De novo motif analysis identified the top six DNA motifs enriched within dynamic peaks. The individual TFs listed in the wedge below the DNA sequence logo recognize the respective DNA motifs. The heatmap quantifies the local protein sequence alignment of the DNA-binding domains for the genes, as determined by the Smith–Waterman algorithm (Farrar 2006). (D) Dynamic ATAC-seq peaks are classified by the presence of each DNA motif. The red bars represent the number of dynamic ATAC-seq peaks within the immediate increase, transient increase, and gradual increase categories; the blue bars correspond to the transient decrease and gradual decrease classes. (E) Red, blue, and gray traces are composite motif densities relative to ATAC peak summits for the increased, decreased, and nondynamic peak classes. The y-axis quantifies the density of the indicated position-specific weight matrix, and each motif instance is weighted by its conformity to a composite motif. (F) Dynamic traces of peaks that exclusively contain the specified motif indicate that CEBP, GR, and AP-1 associate with increasing accessibility; SP and TWIST associate with decreasing accessibility. Peak traces are colored as in panel B. These conclusions are consistent with the reciprocal analysis from panel E.

