Figure 3.
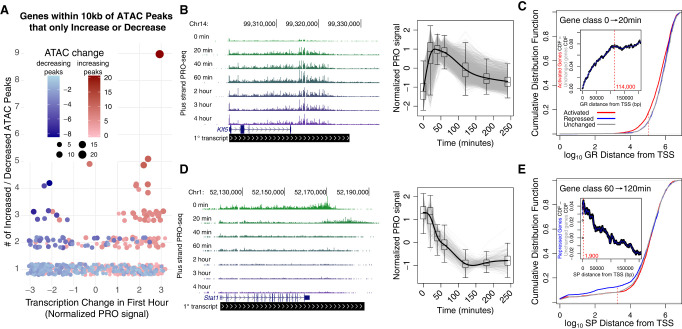
Chromatin accessibility, transcription dynamics, and proximity guide inference of cis-edges between REs and target genes. (A) Change in gene expression correlates with local accessibility change over the first hour. Each data point represents a gene within 10 kb of either only increased (red) or decreased (blue) peaks. The y-axis indicates the number of increased or decreased accessibility peaks near the gene, and the x-axis represents the normalized change in gene transcription over the first hour. (B) Klf5 (left) is part of a cluster of 1717 immediately and transiently activated genes (gray traces on the right). (C) Cumulative distribution plots showing distance between GR-bound REs and genes either activated (red), repressed (blue), or unchanged (gray) over the first hour of the time course. The left-shift of the red curve suggests that ATAC-seq peaks with GR motifs are closer to the 20- versus 0-min activated gene class. The inset plot reports the difference in cumulative distribution between the activated and unchanged gene classes as distance from the TSS increases. The leveling off of the traces at 114 kb from the TSSs suggests that GR-mediated transcription activation requires GR to bind within 100 kb of the TSS. (D) Stat1 (left) is part of a cluster of repressed genes (gray traces on the right). (E) ATAC-seq peaks with SP motifs are closer to the 60- versus 120-min repressed gene class. Traces converge 1900 bases from the start sites, suggesting that the functional distance of SP-mediated gene repression is within 2 kb of TSSs.

