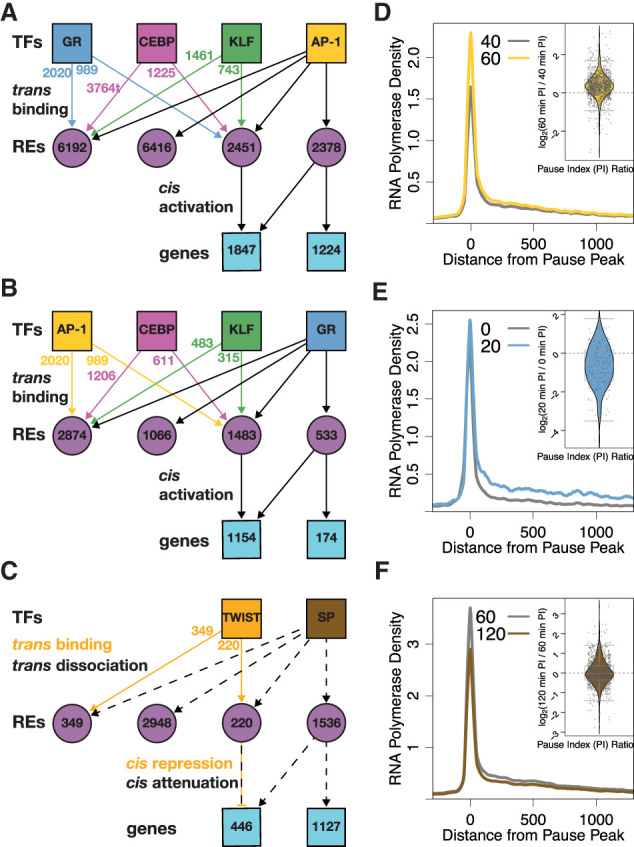
Figure 4.

Constrained networks downstream from AP-1, GR, and SP identify genes regulated by individual factors. Simplified networks highlight the number of REs and genes that are combinatorially or individually regulated by AP-1 (A), GR (B), and SP (C). Factors bind/dissociate from REs (purple circles) and regulate genes (blue squares). Colored arrows and numbers indicate the contribution of nonlead factors to RE activity. Combinatorially regulated REs are bound by the lead TF and either one or more of the other TFs. The composite PRO-seq signal is plotted relative to the promoter-proximal pause peak of 1224 genes solely regulated by AP-1 (D), 174 genes regulated by GR (E), and 1127 genes regulated by SP (F). Inset violin plots illustrate the change in pause index for the gene set for the indicated time points. Each data point is a gene, and all genes were input from the composite.
