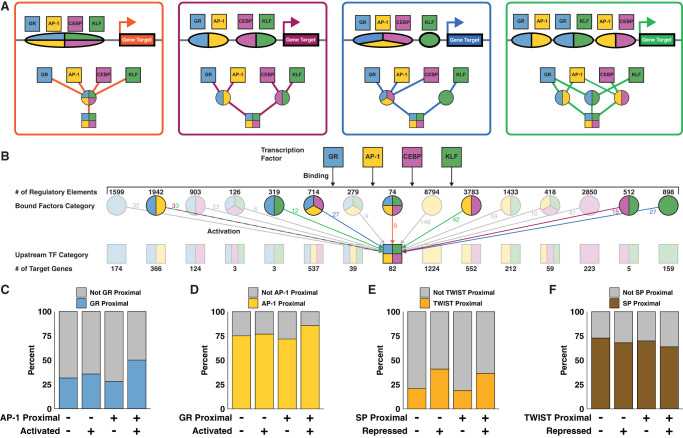
Figure 6.
TFs bind REs and activate genes individually and combinatorially. (A) Schematics and modular networks illustrate four variations in AP-1, CEBP, GR, and KLF binding patterns that can lead to activation of gene targets: All four factors bind to a single RE (orange); two REs, each bound by two factors (purple); three factors bind one RE and one factor binds another (blue); and a more complex combination with redundant factor contributions at multiple REs (green). (B) A wide network depicts cooperation between TFs. Top squares indicate GR, AP-1, CEBP, and KLF TF families. Second row circles represent 15 classes of REs, each bound by a different combination of factors. Third row squares represent 15 classes of genes, each regulated by a different combination of factors. There are multiple potential combinations of REs that can produce the same gene class, as illustrated in A. The middle square representing the 82 genes activated by all four factors is an example of variable regulatory combinations. Colored arrows and numbers correspond to RE combinations as depicted in A. (C) Genes were sorted into categories based on proximity to AP-1 motifs, proximity to GR motifs, and activation status. We calculated 95% confidence intervals for odds ratios based on contingency tables consisting of genes stratified by their proximity to inferred AP-1 and GR REs and by whether the genes were dynamic. The confidence interval for genes that are not proximal to inferred AP-1 REs is 0.97 to 1.49. The confidence interval for genes that are proximal to inferred AP-1 REs is 2.3 to 2.89. The increase in odds ratio prediction suggests that activated genes proximal to AP-1 are significantly more likely to be proximal to GR than are nonactivated genes. (D) The confidence interval for genes not proximal to GR is 0.96 to 1.27. The confidence interval for genes proximal to GR is 1.94 to 2.87. Again, the increase indicates that AP-1 and GR factors coordinate to activate transcription. (E) The fraction of repressed genes proximal to TWIST increases regardless of the presence of SP with odds ratio confidence intervals of 2.2–3.07 and 2.21–2.79 when not proximal and proximal to SP peaks, respectively. (F) We find a lower proportion of repressed genes proximal to SP motifs in both the presence and absence of TWIST. The odds ratio confidence intervals do not change with the presence of TWIST, going from 0.71–0.89 to 0.64–0.9 when in proximity to predicted TWIST REs.

