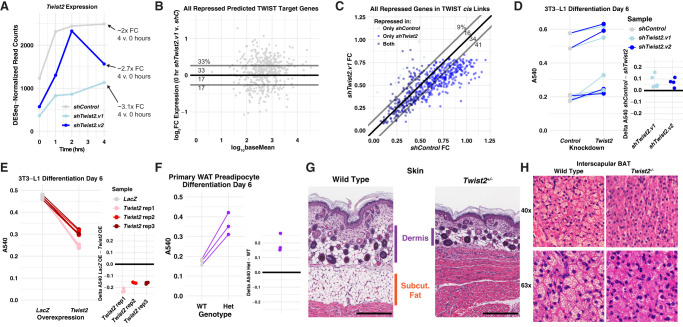
Figure 8.
TWIST2 represses target genes and inhibits adipogenesis. (A) Twist2 expression as measured by RNA-seq at indicated time points following differentiation initiation. shTwist2.v1 is a single shRNA construct, whereas shTwist2.v2 is a combination of shRNAs targeting Twist2. (B) Expression of predicted TWIST2 target genes that are repressed in the RNA-seq time course before addition of the adipogenic cocktail. The y-values indicate fold-change of gene expression in Twist2 knockdown versus control, and x-values indicate basal expression of each gene. The majority of genes are expressed to a higher degree in the knockdown samples, suggesting that loss of basal TWIST2 leads to derepression of target genes. (C) Each data point represents one of the 520 predicted TWIST2 target genes that are repressed in the RNA-seq time course. We identified the time point comparison for which each gene shows the greatest degree of repression. The x-values represent fold-change for the relevant comparison in the shTwist2 samples, and y-values represent fold-change for the same comparison in the shControl samples. Predicted TWIST2 target genes largely show a greater degree of repression in the shTwist2 samples owing to a relatively greater magnitude of Twist2 activation. (D) shControl or shTwist2 3T3-L1s were stained with Oil Red O after 6 d of differentiation. Absorbance at 540nm represents total lipid uptake of the cell population. Lines connect control and experimental samples from the same experimental replicate. Inset plot displays the difference in absorbance between the indicated shRNA treatment and the control knockdown for each replicate. TWIST2 depletion causes an increase in fat uptake, implicating the TF as a negative regulator of differentiation. (E) 3T3-L1s overexpressing either LacZ or TWIST2 were stained with Oil Red O after 6 d of differentiation. TWIST2 overexpression causes a decrease in fat uptake, supporting the conclusion that TWIST2 is a negative regulator of adipogenesis. Lines and inset plot are used as in D. (F) Primary WAT preadipocytes harvested from P3 mice were induced to differentiate for 6 d and stained with Oil Red O. We pooled preadipocytes from animals with the same genotype. Wild-type and heterozygous samples consist of preadipocytes pooled from two and six animals, respectively. The pooled samples were plated in triplicate for the experiment. Preadipocytes harvested from Twist2+/− pups show increased Oil Red O staining compared with those harvested from wild-type mice. (G) Hematoxylin and eosin staining of skin shows collapse of dermal (purple bars) and subcutaneous WAT (orange bar) in P3 Twist2+/− mice compared with the wild type. Scale bars indicate 200 µm. (H) Hematoxylin and eosin staining of interscapular brown fat shows reduced fat droplets (large white/light colored circles) in P14 Twist2−/− mice compared with the wild type. Images taken at either 40× (top) or 63× (bottom) magnification.

