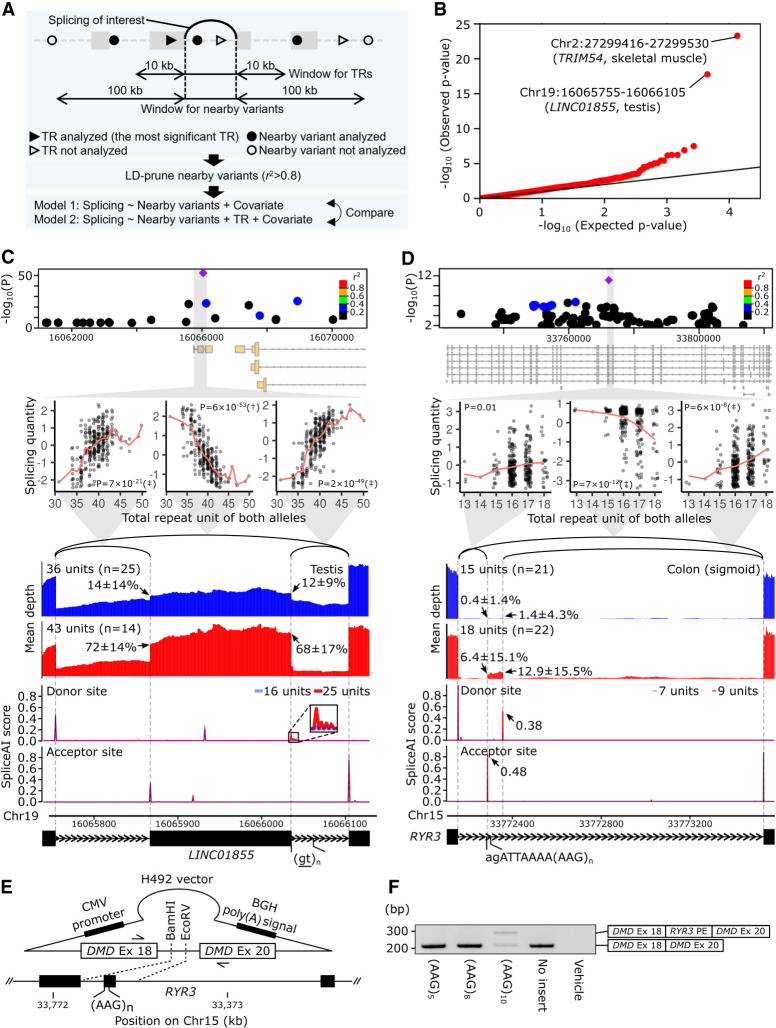
Figure 2.
spl-TRs explain splicing variation independently of nearby variants. (A) Overview of ANOVA tests comparing two linear regression models explaining the variation of each splicing event. One model used TR dosage and nearby variants, whereas the other used nearby variants only. (B) QQ plot of P-values of ANOVA tests comparing the two models for 11,435 splicing events. The black y = x line corresponds to the null hypothesis. (C,D) Representative spl-TRs associated with splicing variation independently of nearby variants. Shown are associations of the spl-TR and neighboring variants with splicing quantity (top panel), correlations between TR dosages and splicing quantities (second panel from the top), mean RNA-seq depth of samples with a smaller or larger TR dosage (third panel from the top), SpliceAI scores of splice donor or acceptor site for sequences having a shorter or longer TR allele (fourth panel from the top), and exon–intron structures (bottom). (Top panel) Only variants whose nominal P-value was <0.01 are shown. Purple diamond: spl-TR; circle: other variants color-coded according to Pearson correlation coefficient between the variant and spl-TR dosages. (Second panel from the top) The splicing quantity indicates the normalized proportion in clustered splicing events (see Methods subsection “Mapping of spl-TRs”). The red line indicates the mean at each TR dosage. Nominal P-values of linear regression analysis in FastQTL are shown in each plot. (†) The top association in the gene (Q-value < 0.05); (‡) other significant associations (P-value < 8.7 × 10⁻⁵ for LINC01855 and 7.8 × 10⁻⁶ for RYR3; see Methods subsection “Identification of all significant TR–splicing pairs in each gene”). (Third panel from the top) Arrow: mean ± standard deviation of ψ5 or ψ3. (Fourth panel from the top) Because SpliceAI scores are almost the same between shorter (blue) and longer (red) TR alleles, the bars look purple in the most plotted region. The inset is a magnified image of junctions of splicing events whose alteration by TRs was supported by SpliceAI. (E,F) Experimental validation of the spl-TR at RYR3 using minigene assay. (E) Schematic representation of H492 minigene vector. The vector is constructed to have DMD exons 18 and 20, and between these exons the RYR3 pseudoexon and flanking sequences were inserted. For the synthesis of mRNA, the vector contains a cytomegalovirus (CMV) enhancer–promoter and a bovine growth hormone (BGH) polyadenylation signal. The vector was transfected into HeLa cells, and extracted RNA was amplified using the primers indicated by arrows in a reverse-transcription polymerase chain reaction (RT-PCR) assay. (F) RT-PCR products of minigene assay for RYR3 pseudoexon (PE). Here, 284- and 208-bp transcripts were generated from the vector carrying the (AAG)10 allele (A), whereas only a 208-bp transcript was generated from the vectors carrying the (AAG)3 or (AAG)8. Shown on the right is a schematic description of the RT-PCR products. The longer product consists of DMD exon 18, RYR3 PE, and DMD exon 20, whereas the smaller product does not contain the RYR3 PE.

