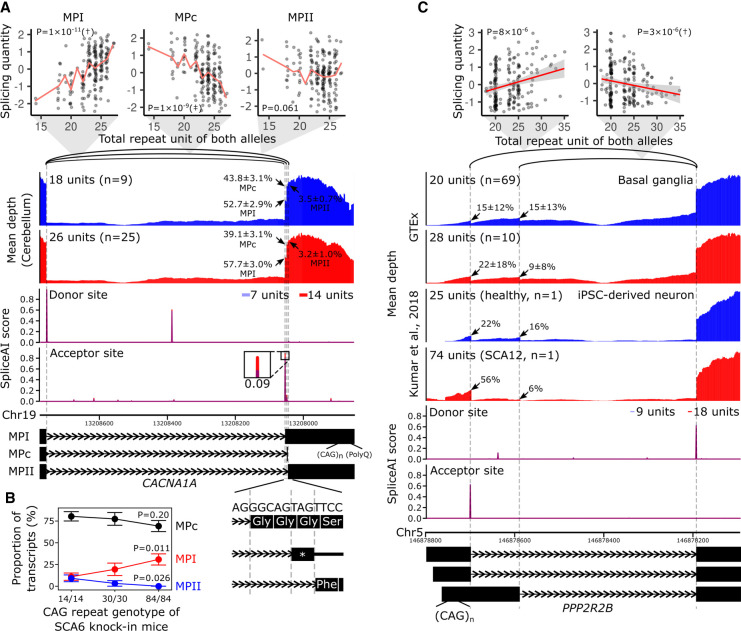
Figure 4.
Splicing alterations by the spl-TR associated with SCA6 and SCA12. (A,C) Shown are correlations between TR dosages and splicing quantities (top), mean RNA-seq depth of samples with a smaller or larger TR dosage (second panel from the top), SpliceAI scores of splice donor or acceptor site for sequences having a shorter or longer TR allele (third panel from the top), and representative exon–intron structures (bottom). (Top panel) The splicing quantity indicates the normalized proportion in clustered splicing events (see Methods subsection “Mapping of spl-TRs”). The red line indicates the mean at each TR dosage (A); the red line and gray shading represent the regression line and 95% confidence interval, respectively (C). Nominal P-values of linear regression analysis in FastQTL are shown in each plot. (†) The top association in the gene (Q-value < 0.05); (‡) other significant associations (P-value threshold: CACNA1A, 5 × 10⁻⁶; PPP2R2B, 4 × 10⁻⁶; see Methods subsection “Identification of all significant TR–splicing pairs in each gene”). (Second panel from the top) iPSC-derived neurons of an SCA12 patient with 14/60 CAG repeats and a healthy individual with 9/16 units are shown (C) (Kumar et al. 2018); arrow: mean ± standard deviation of ψ5 or ψ3 of the junction. (Fourth panel from the top) The inset is a magnified image of junctions of splicing events whose alteration by TRs was supported by SpliceAI. The differences in SpliceAI scores between shorter and longer TR alleles are shown above or below the insets. Transcript models at the bottom are ENST00000360228 for MPI, ENST00000636473 for MPc, and ENST00000636389 for MPII (A) and ENST00000530902.5, ENST00000532154.5, and ENST00000394411.8 (C). (B) Proportions of MPI, MPII, and MPc isoforms in knock-in mouse models of SCA6 harboring 14, 30, or 84 CAG repeats at the humanized last exon of Cacna1a. The total number of sequenced clones was 55 from four Cacna1a14Q/14Q samples, 31 from two Cacna1a30Q/30Q samples, and 52 from three Cacna1a84Q/84Q samples. P-values of tests comparing proportions between Cacna1a14Q/14Q and Cacna1a84Q/84Q are shown.

