Figure 2.
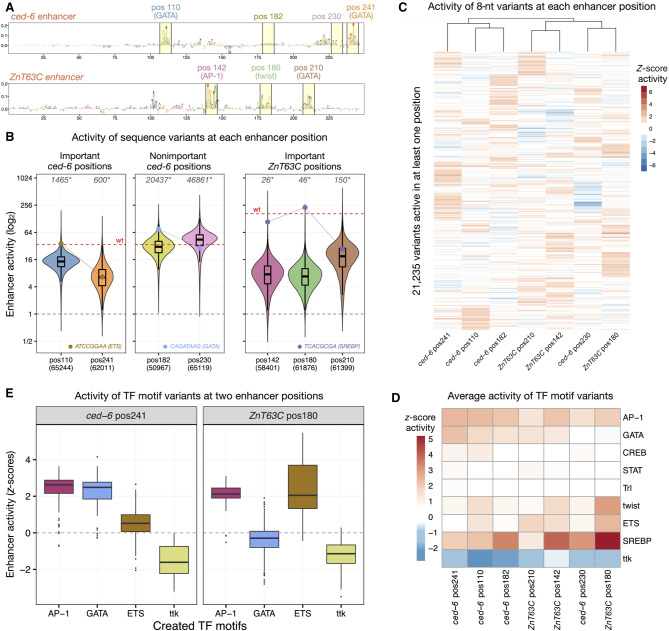
Sequence constraints at different enhancer positions. (A) DeepSTARR-predicted nucleotide contribution scores for the ced-6 (top) and ZnT63C (bottom) selected enhancer sequences. Selected 8-nt motif positions and nonimportant control positions are highlighted in yellow with the respective numerical position, TF motif identity, and different colors. (B) Distribution of enhancer activity for all enhancer variants detected in each enhancer position. The activity of the wild-type sequence of each enhancer (wt, red dashed line) or of inactive sequences (gray dashed line) are highlighted, together with the activity of example sequence variants that create different TF motifs (ETS, GATA, and SREBP; dots and connected lines). Number of variants tested in each position are shown on the x-axis, whereas the number of variants with higher activity than wild type is shown on the top (gray, *). (C) Heatmap of Z-scores of log2 enhancer activity of 21,235 variants across all seven enhancer positions. Only variants assessed in all positions and active (Z-score > 1) in at least one are shown. Variants were clustered using hierarchical clustering and their activity is colored in shades of red (activating) and blue (repressing). (D) Heatmap of average Z-scores of log2 enhancer activity of variants creating each TF motif type (y-axis) across all enhancer positions (x-axis; sorted as in C). Motif activity is colored in shades of red (activating) and blue (repressing). (E) Distribution of Z-scores of log2 enhancer activity for variants creating each of four TF motifs (AP-1, GATA, ETS, ttk) in two selected enhancer positions (ced-6 pos241 and ZnT63C pos180).

