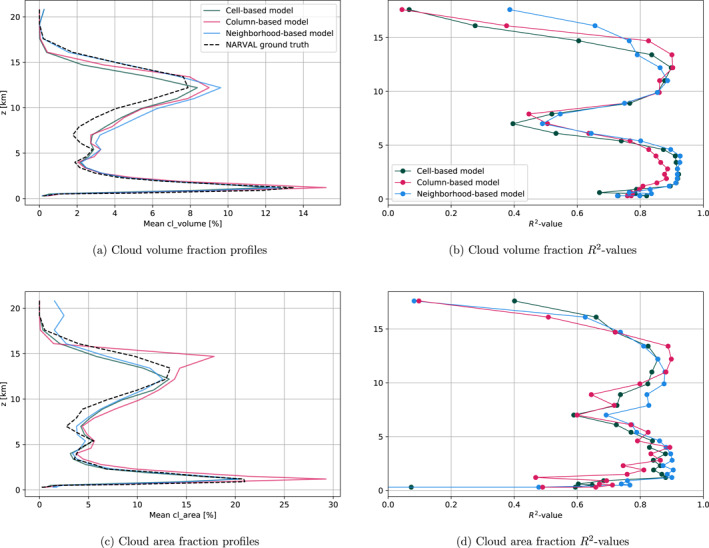
Figure 6.

Evaluation of Quasi‐Biennial Oscillation in a Changing Climate R2B5 cloud volume and cloud area models on NARVAL R2B5 data. The layer‐wise averaged R 2‐values of the cell‐, column‐, and neighborhood‐based models shown in (b) are (0.74, 0.74, 0.79) and in (d) are (0.72, 0.71, 0.72).
