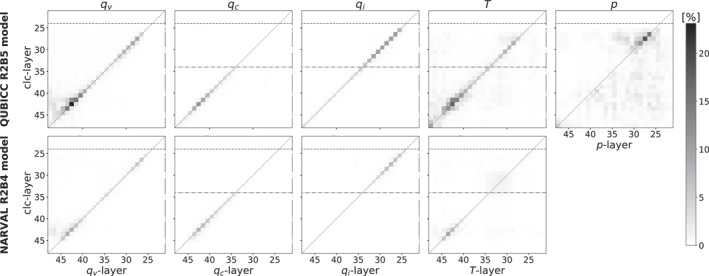
Figure 8.

Average absolute SHAP values of the Quasi‐Biennial Oscillation in a Changing Climate (QUBICC) R2B5 and the NARVAL R2B4 column‐based models when applied to the same, sufficiently large subset of the NARVAL R2B5 data. We use the conventional ICON‐A numbering of vertical layers from layer 21 (at a height of ≈20.8 km) decreasing in height to layer 47, which coincides with Earth's surface. The dashed line shows the tropopause, here at ≈15 km, the dash dotted line shows the freezing level (i.e., where temperatures are on average below 0 degrees C), here at ≈5 km. Tests with four different seeds show that the pixel values are robust (the absolute values never differ by more than 0.55%). The input features that are not shown exhibit smaller absolute SHAP values (ρ < 1.8%, p < 1.5%, z g < 0.7%, land/lake <0.1%) everywhere and are thus omitted.
