Figure 9.

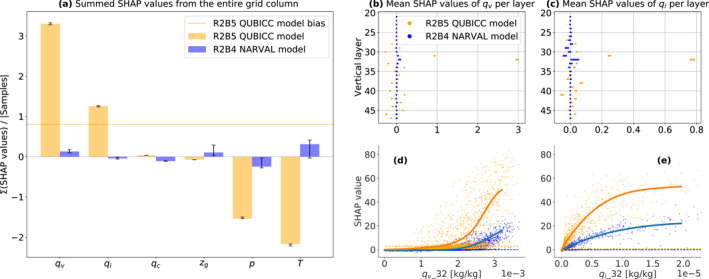
SHAP/Shapley value statistics per input feature for cloud cover predictions on vertical layer 32 (at ≈ 7 km) of the column‐based models with a focus on q v and q i in (b–e). Input features the models have not in common are neglected. As in Figure 8, the Shapley values for both models are computed on the same sets of 104 random NARVAL R2B5 samples (using 10 different seeds). (a): The sum of average SHAP values over all vertical layers. The black lines show the range of values (min/max). The absolute Quasi‐Biennial Oscillation in a Changing Climate R2B5 model bias (of 0.95%) on layer 32 (cf. Figure 6a) can approximately be recovered by summing over all orange values (which yields 0.81%). (b, c): The vertical profiles of SHAP values for q v and q i for all 10 seeds. In the SHAP dependence plots (d, e) we zoom in on the features with the largest SHAP values (q i and q v of layer 32). (d, e): Each dot corresponds to one NARVAL R2B5 sample. The lines show smoothed conditional expectations computed over all seeds. The dashed lines show the average SHAP value of the input features q v and q i on layer 32 whose values can also be found in (b and c).
