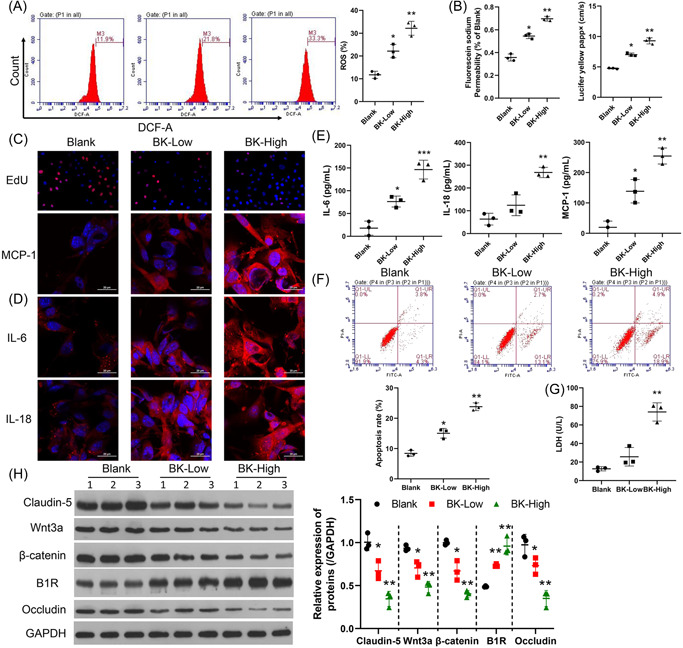
Figure 2.

BK enhanced ROS production, cellular permeability, and inflammation, and reduced cell proliferation and tight junction formation by BMECs. BMECs were treated with BK (low concentration, 100 nM or high concentration, 400 nM). ROS production was determined by flow cytometry, and the respective images are shown (A, left panel). Summarized results from three independent experiments are shown (A, right panel). Cell permeability was tested by sodium fluorescein analysis (B, left panel) and the lucifer yellow assay (B, right panel). Cell proliferation was measured by EdU staining. (C, IL‐6, MCP‐1, and IL‐18 expressions were detected by IF (D) and ELISA (E). (F) The cell apoptosis rate was measured using FCM. (G) LDH levels were determined by ELISA. The levels of claudin‐5, occludin, β‐catenin, Wnt3a, and B1R expression were determined by western blotting (H, left panel). The statistical results of western blot studies conducted in three independent experiments (H, right panel). *p < 0.05; **p < 0.01; ***p < 0.001 versus blank. B1R, bradykinin 1 receptor; BK, bradykinin; BMECs, brain microvascular endothelial cells; DCF‐A, 2′,7′‐dichlorodihydrofluorescein diacetate; EdU, 5‐ethynyl‐2′‐deoxyuridine; ELISA, enzyme‐linked Immunosorbent assay; FCM, flow cytometry; GAPDH glyceraldehyde‐3‐phosphate dehydrogenase; IF, immunofluorescence; IL‐6, interleukin 6; LDH, lactate dehydrogenase; MCP‐1, monocyte chemoattractant protein‐1; ROS, reactive oxygen species.
