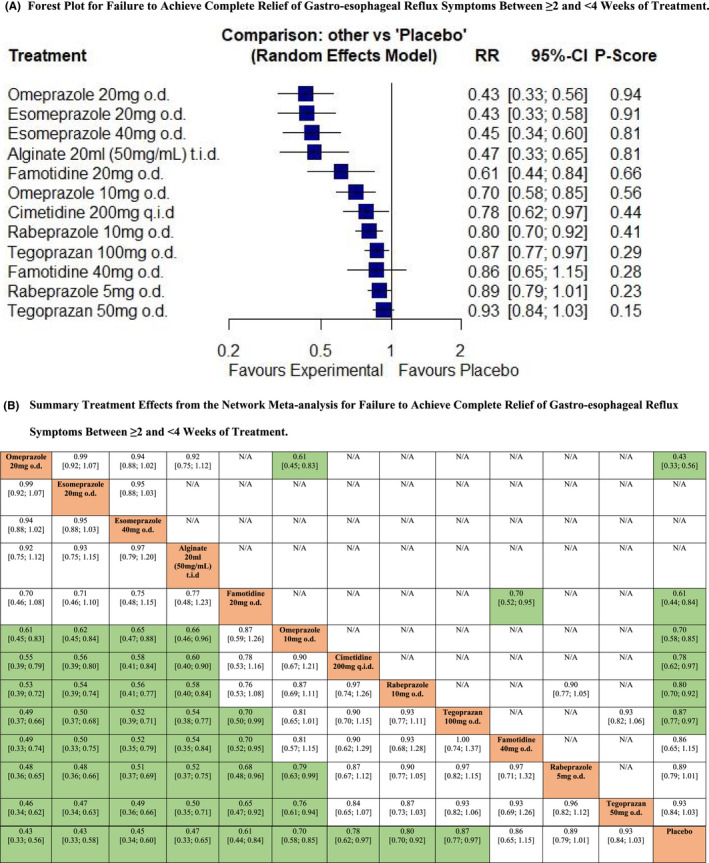
FIGURE 2.

Network meta‐analysis of likelihood of failure to achieve complete relief of gastro‐esophageal reflux symptoms between ≥2 and <4 weeks of treatment. (A) Forest plot for failure to achieve complete relief of gastro‐esophageal reflux symptoms between ≥2 and <4 weeks of treatment. Treatments are reported in order of efficacy ranking according to P‐score. The P‐score is the probability of each treatment being ranked as best in terms of efficacy in the network. (B) Summary treatment effects from the network meta‐analysis for failure to achieve complete relief of gastro‐esophageal reflux symptoms between ≥2 and <4 weeks of treatment. League table of pairwise comparisons in the network meta‐analysis for the relative risk of failure to achieve complete relief of gastro‐esophageal reflux symptoms between ≥2 and <4 weeks of treatment. Relative risk with 95% confidence intervals in parentheses. Comparisons, column versus row, should be read from left to right, and are ordered relative to their overall efficacy. The treatment in the top left position is ranked as best after the network meta‐analysis of direct and indirect effects. Boxes highlighted in green indicate significant differences. Direct comparisons are provided above the drug labels, and indirect comparisons are below. N/A, not applicable, no RCTs making direct comparisons.
