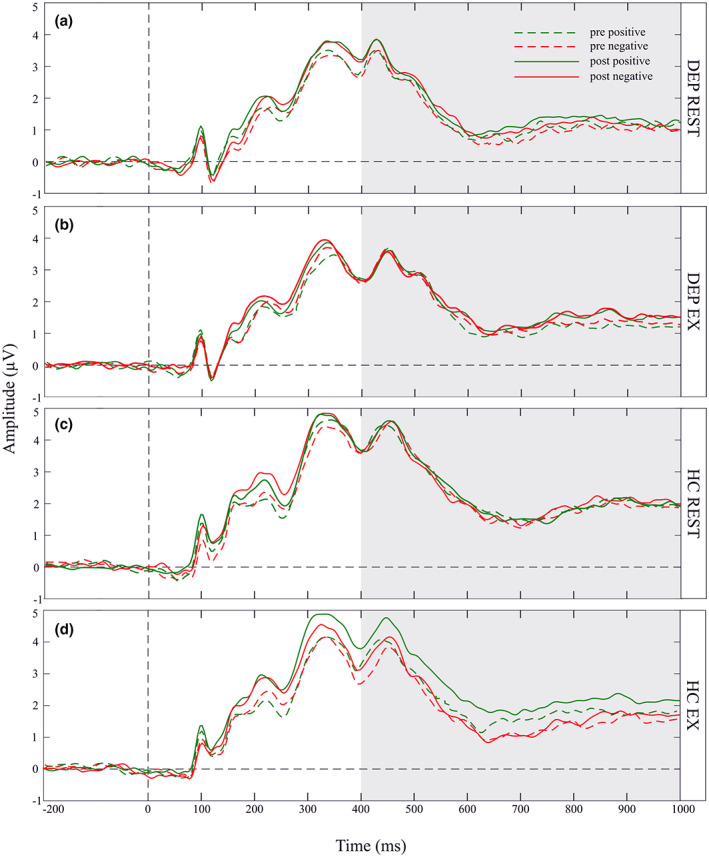
FIGURE 2.

Grand‐average ERP waveforms. Grand‐averaged ERP waveforms at electrode Pz are separately depicted in the four panels: (a) depression group during the rest protocol (DEP REST); (b) depression group during the exercise protocol (DEP EX); (c) healthy control group during the rest protocol (HC REST); and (d) healthy control group during the exercise protocol (HC EX). Each panel depicts waveforms in response to positive (green line) and negative (red line) pictures, which were assessed either before a protocol (dotted line), or after a protocol (solid line). The LPP was scored as the mean amplitude in the time window from 400 to 1000 ms following picture onset (shaded area).
