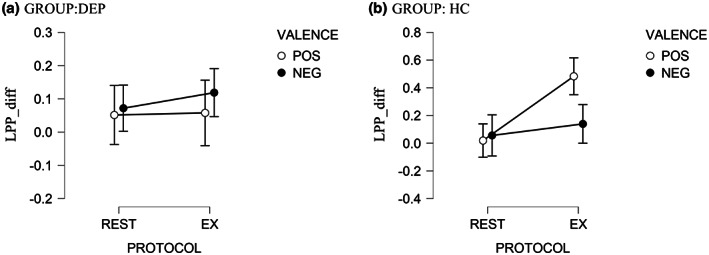
FIGURE 3.

The effects of moderate‐intensity exercise (EX) versus seated REST (REST) on changes in LPP in response to positive and negative pictures. Y‐axis represents LPP_diff, calculated as the difference score of the LPP post‐experimental protocol minus the LPP pre‐experimental protocol. LPPs increased more for positive pictures in the HC compared to the DEP group, while changes in LPP for negative pictures did not differ across groups. Error bars represent standard errors. DEP, depression group; HC, healthy control group. POS, positive pictures; NEG, negative pictures.
