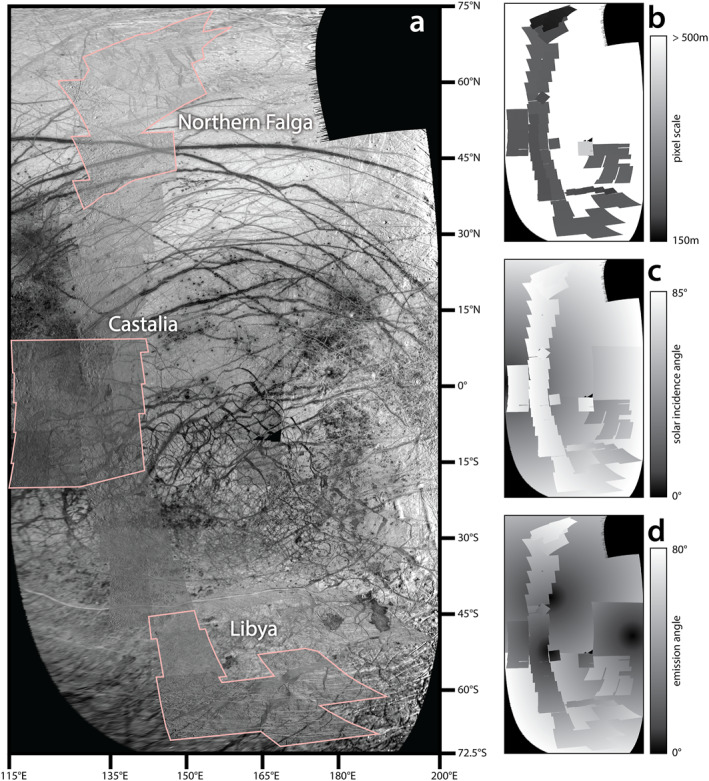
Figure 1.

(a) Image mosaic used for this study. The three study areas discussed in Section 3 are highlighted in pink. (b) Pixel scale of input images, on a linear gradient from 150 to 500 m. The area labeled as >500 m is composed of images with pixel scales of approximately 1.5 km (“background images” in Table 1). (c) Solar incidence angle for input images. Note that most of the study areas outlined in (a) are covered by near‐terminator imaging. (d) Emission angle to the spacecraft camera for the input images. Note that the Libya and Northern Falga study areas are only covered by images with oblique viewing angles.
