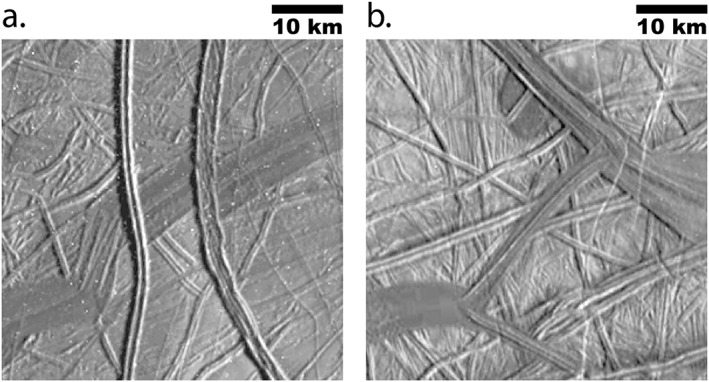
Figure 3.

Time sequence examples for plate boundaries on Europa, initially defined by Sarid et al. (2002) and Patterson et al. (2006). Both examples are located near Castalia Macula, north is up. (a) Two parallel N‐S trending boundaries crosscut an older NE‐SW trending dark band that also forms a plate boundary. Plate motions occurred along the band first, and then along the two N‐S boundaries. (b) A NE‐SW trending dark band in the center of the image merges at either end at triple junctions with adjacent NW‐SE trending dark bands. All the bands form plate boundaries that were active at the same time.
