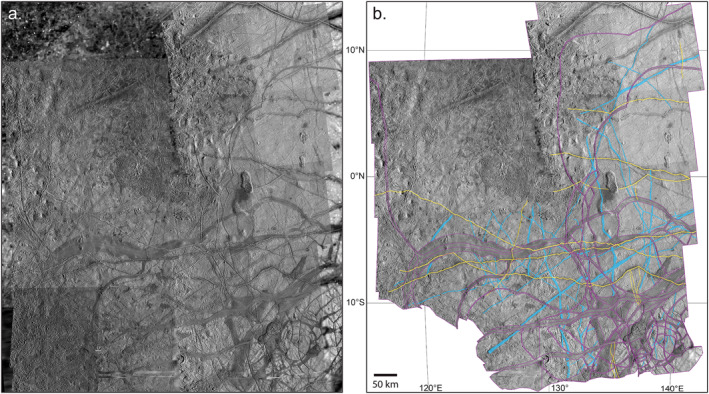
Figure 11.

Castalia study area. (a) The base mosaic of images is shown with higher‐resolution Galileo observations on top of lower resolution global‐scale images. (b) Only the high‐resolution area is shown with interpretation of plate boundaries represented as thin purple lines (compare to subsequent figures). The colors in (b) denote prominent features that are younger than the plate boundaries in yellow (which are ignored in the reconstruction process), and prominent features older than the plate boundaries in blue. Images are shown in orthographic projection centered at 0°N, 130°E; north is up. The scale bar and coordinates for graticules are shown in (b).
