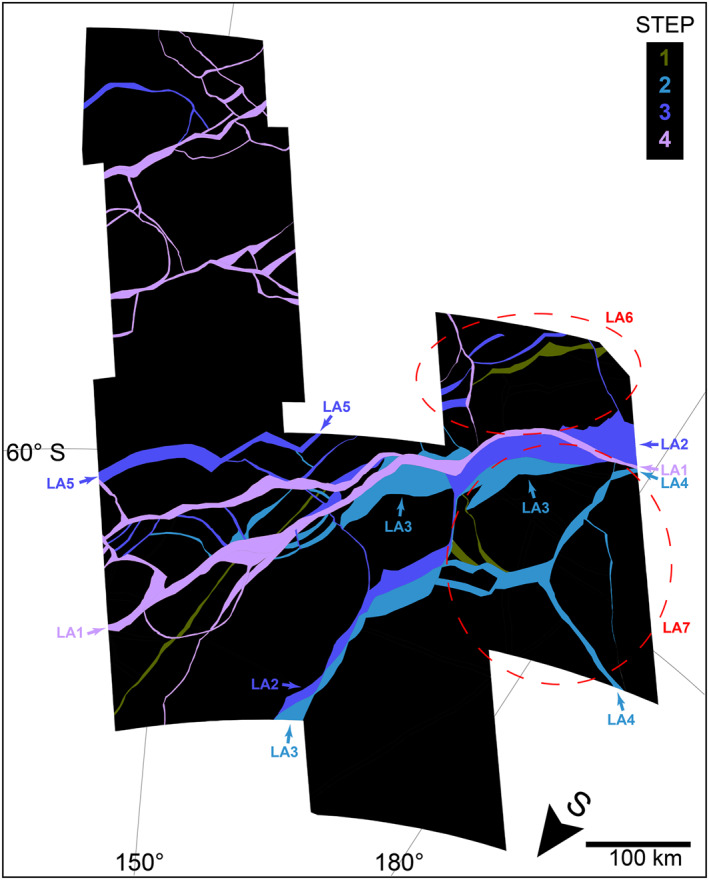
Figure 17.

Time sequence of final motion along plate boundaries in the Libya Linea area. Mapped material of plate boundaries are colored from oldest to youngest in a green to blue to purple color scale. The “step” scale shows the latest reconstruction step during which the boundaries of that color were still active; refer to Figure 18 for more detail. Note that young plate boundaries may also be active in earlier stages. Map is in orthographic projection centered at 59°S, 167°E.
