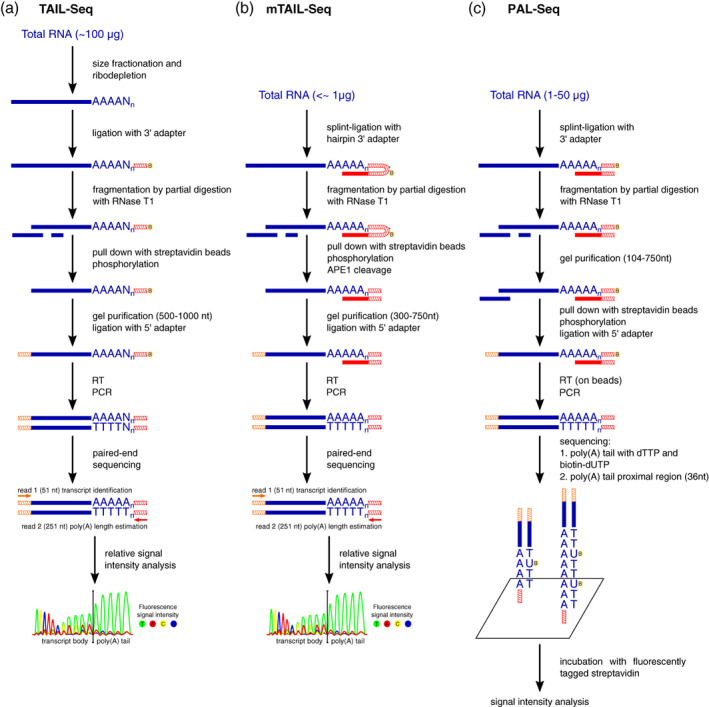
FIGURE 3.

Comparison of TAIL‐Seq, mTAIL‐Seq, and PAL‐Seq protocols for mRNA poly(A) tail sequencing. The red line indicates the oligo(dT) sequence. Red hatched lines indicate the 3′ adapter sequence. Orange hatched lines indicate the 5′ adapter sequence. The “B” in the yellow circle indicates biotin. Asterisks indicate an abasic site in the 3′ adapter.
