FIGURE 3.

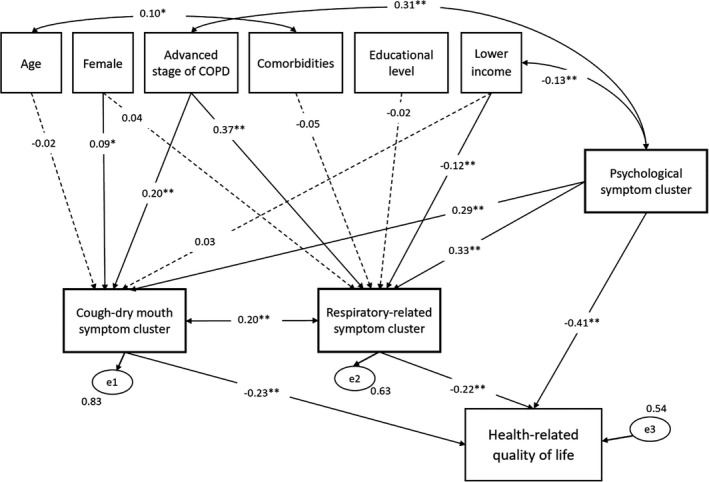
Final model with standardised coefficients. Note: The dashed lines with arrows represent non‐significant relationships (p > .05). *p < .05, **p < .01

Final model with standardised coefficients. Note: The dashed lines with arrows represent non‐significant relationships (p > .05). *p < .05, **p < .01