
FIGURE 2.
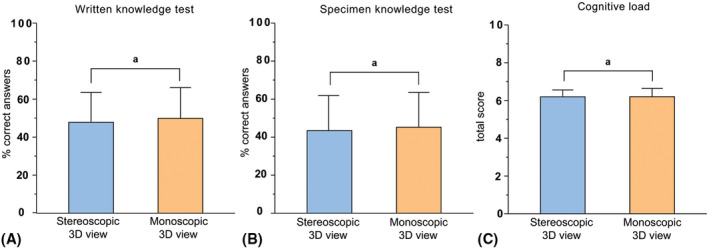
Differences in overall mean percentages correct answers on the (A) written knowledge test, (B) specimen knowledge test and (C) cognitive load test between stereoscopic 3D view (n = 32) and monoscopic 3D view (n = 34) groups. 3D, three‐dimensional; anot statistically significant differences