
Fig. 4.
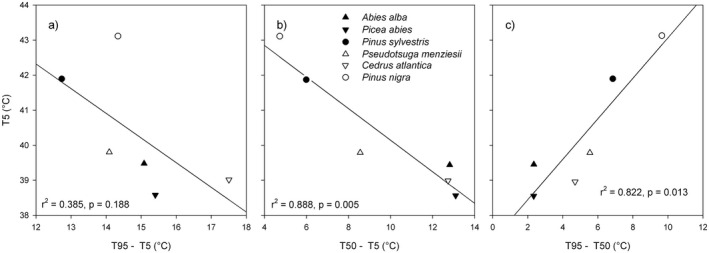
Relationships between PSII maximum quantum yield (Fv/Fm) breakpoint temperature, T5, and decline width. The temperature windows are shown when Fv/Fm declines from (a) 95% to 5% of the maximum Fv/Fm level (T95–T5), (b), the Fv/Fm decline from 5% to 50% of the maximum Fv/Fm level, and (c) Fv/Fm declines from 50% to 95% of the maximum Fv/Fm level.