
FIGURE 2.
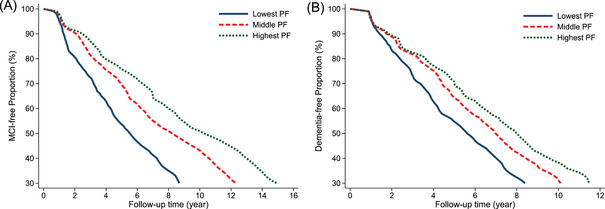
Mild cognitive impairment (MCI)–free proportion in the cognitively intact group (A) and dementia‐free proportion in the MCI group (B) by pulmonary function (PF). Note: Model adjusted for age, sex, education, income, smoking, alcohol consumption, physical activity, body mass index, heart disease, hypertension, diabetes, stroke, depression, and apolipoprotein E (APOE) ε4