

Abstract
Background
Pollen exposure is associated with respiratory symptoms in children and adults. However, the association of pollen exposure with respiratory symptoms during infancy, a particularly vulnerable period, remains unclear. We examined whether pollen exposure is associated with respiratory symptoms in infants and whether maternal atopy, infant's sex or air pollution modifies this association.
Methods
We investigated 14,874 observations from 401 healthy infants of a prospective birth cohort. The association between pollen exposure and respiratory symptoms, assessed in weekly telephone interviews, was evaluated using generalized additive mixed models (GAMMs). Effect modification by maternal atopy, infant's sex, and air pollution (NO2, PM2.5) was assessed with interaction terms.
Results
Per infant, 37 ± 2 (mean ± SD) respiratory symptom scores were assessed during the analysis period (January through September). Pollen exposure was associated with increased respiratory symptoms during the daytime (RR [95% CI] per 10% pollen/m3: combined 1.006 [1.002, 1.009]; tree 1.005 [1.002, 1.008]; grass 1.009 [1.000, 1.23]) and nighttime (combined 1.003 [0.999, 1.007]; tree 1.003 [0.999, 1.007]; grass 1.014 [1.004, 1.024]). While there was no effect modification by maternal atopy and infant's sex, a complex crossover interaction between combined pollen and PM2.5 was found (p‐value 0.003).
Conclusion
Even as early as during the first year of life, pollen exposure was associated with an increased risk of respiratory symptoms, independent of maternal atopy and infant's sex. Because infancy is a particularly vulnerable period for lung development, the identified adverse effect of pollen exposure may be relevant for the evolvement of chronic childhood asthma.
Keywords: aeroallergen, cohort study, infancy, interaction, longitudinal study
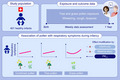
This longitudinal study included 401 healthy infants from the Basel‐Bern Infant Lung Development (BILD) cohort. The association between pollen exposure and weekly telephone‐assessed respiratory symptoms was evaluated. Increased exposure to tree and grass pollen, both combined and separately, was associated with an increased risk of respiratory symptoms during the first year of life. There was no effect modification by maternal atopy and infant's sex; however, we found a complex interaction between combined pollen and PM2.5. Abbreviations: PM2.5, particulate matter with an aerodynamic diameter ≤ 2.5 μm
Abbreviations
- BILD
Basel‐Bern Infant Lung Development
- GAMM
generalized additive mixed model
- IgE
immunoglobulin E
- NO2
nitrogen dioxide
- PM2.5
particulate matter with a diameter ≤2.5 µm
- RR
risk ratio
- ti
tensor product interaction
1. INTRODUCTION
Exposure to pollen has been associated with an increased risk of respiratory symptoms in both allergic 1 and nonallergic 2 , 3 individuals. This indicates different underlying mechanisms. On the one hand, pollen can cause immunoglobulin E (IgE)‐mediated respiratory symptoms in sensitized individuals. 1 On the other hand, pollen can negatively impact antiviral immunity, which consequently increases susceptibility to viral infections and related respiratory symptoms independent of allergic predisposition. 2 The recently found positive correlation between pollen concentrations and SARS‐CoV‐2 infection rates supports this finding. 4 The effect of pollen may be modified by genetic and environmental factors. While prepubertal males are at increased risk of sensitization against aeroallergens 5 and offspring of atopic mothers 6 , 7 are predisposed to develop allergic diseases in general, male sex is additionally associated with a higher risk for pediatric respiratory morbidity in comparison with females. 8 Thus, assuming allergy and viral infection are underlying mechanisms of respiratory symptoms, male sex and maternal atopy may increase the impact of pollen exposure in children. Similarly, this is expected for air pollution, which has been found to aggravate the effect of pollen through various mechanisms. Air pollutants can increase the allergen content of pollen and lead to an extended allergen release by damaging the pollen surface. 9 Particulate pollutants can bind to allergenic fragments and thereby serve as carriers that transport allergens deep into the respiratory tract. 10 In addition, air pollutants suppress antiviral immunity 11 , 12 and damage the airway epithelium, 13 , 14 increasing susceptibility to respiratory infections and resulting respiratory symptoms.
However, data on the association of pollen with respiratory symptoms and potential effect modification by maternal atopy, infant's sex and air pollution in infants are missing. This is despite the fact that infancy is a particularly vulnerable time period for the development of the lung and later respiratory disease. 15 , 16 , 17 , 18 To prevent short‐ and long‐term respiratory health problems, a better understanding of the association between pollen and respiratory symptoms in infants is needed. 19 , 20 , 21 This is particularly relevant with regard to the increasing prevalence of asthma and allergic rhinoconjunctivitis in children and adults, 22 which has been observed in the context of the ongoing urbanization and the prolonged and more intense pollen seasons. 23 , 24 , 25
We hypothesize (1) that pollen exposure increases the risk of respiratory symptoms even during the first year of life and (2) that this risk is increased for infants of atopic mothers, male sex, and those exposed to higher air pollution levels. To test our hypotheses, we used longitudinal data from an ongoing birth cohort of healthy infants and assessed (1) the association of pollen exposure with respiratory symptoms during the first year of life and (2) the effect modification by maternal atopy, infant's sex, and air pollution (particulate matter with an aerodynamic diameter ≤2.5 µm (PM2.5), nitrogen dioxide (NO2)).
2. METHODS
2.1. Study population
Data were collected from the Basel‐Bern Infant Lung Development (BILD) cohort, an ongoing prospective birth cohort of unselected healthy infants. Exclusion criteria for the cohort study are ethnicity other than Caucasian, major birth defects, perinatal diseases, and major respiratory disease diagnosed after birth. 26 Because air pollution data were only available from January 1, 2005, to January 1, 2017, solely infants enrolled in the BILD cohort between January 1, 2005, and January 1, 2016, were included in the present study. For the present study, the following additional exclusion criteria applied: preterm birth (< 37 weeks), <50 symptom scores assessed during the 1st year of life (to ensure a comparable number of observations among infants), moved abroad, and missing data (Figure S1). The Ethics Committee of Northwest and Central Switzerland (EKNZ, Basel, Switzerland) and the Bernese Cantonal Ethics Research Committee (KEK, Bern, Switzerland) approved the study protocol, and the written informed consent was obtained from the parents at enrollment.
2.2. Outcome
Daytime and nighttime respiratory symptoms (cough, wheezing, and dyspnea) were assessed weekly throughout the first year of life. Trained study nurses called the parents and evaluated the severity of respiratory symptoms during the week preceding the telephone interview with a standardized 5‐category severity score, ranging from 0 to 4, with 0 indicating no symptoms and scores ≥1 indicating symptoms with increasing severity. Further details are described elsewhere. 27 , 28
2.3. Exposure
All environmental exposures (pollen concentrations, PM2.5, NO2, temperature, and relative humidity) were linked to the infant's residential addresses. Addresses were geocoded using the building registry of the Swiss Federal Statistical Office (Neuchâtel). Address changes within the study period were considered for the exposure assignment.
2.3.1. Pollen
Daily pollen concentrations were monitored by the Swiss Federal Office of Meteorology and Climatology (MeteoSwiss) at 14 monitoring stations in Switzerland. Pollen samples were obtained using a Burkard volumetric spore trap. 24 Pollen traps considered for this study do not operate from October through December 24 , 29 ; therefore, only pollen data from January through September were considered for the analyses. Because air pollution data were only available from January 1, 2005, to January 1, 2017, pollen data were also restricted to this time period. Using data from the monitoring station closest to the participant's residential address (mean distance: 10.5 km), 7‐day averages were calculated for hazel, birch, alder, and grass pollen concentrations for the week prior to each telephone interview. For the analysis, three relevant pollen groups were created aggregating the averaged pollen concentrations (pollen/m3) for the respective species: combined pollen (hazel, birch, alder, and grass), tree pollen (hazel, birch, and alder), and grass pollen. For each pollen group, the analyzed time period was restricted to months with mean aggregated pollen concentrations >0.1 pollen/m3. Months below the cutoff were excluded due to minimal variation in pollen concentrations, similar to other studies. 30 , 31 Since the calculated pollen concentrations were right‐skewed, combined, tree, and grass pollen concentrations were log‐transformed (natural logarithm (ln)) with an offset of 1, as done previously. 32 , 33
2.3.2. Air pollution
Daily PM2.5 and NO2 concentrations were obtained from previously developed spatiotemporal models. 34 , 35 In brief, PM2.5 concentrations were estimated at a spatial resolution of 100 100m with geostatistical hybrid models taking advantage of the multiangle implementation of atmospheric correction (MAIAC) spectral aerosol optical depth (AOD) data in combination with other spatiotemporal predictor variables. 35 These models explain over 80% of the local variation in PM2.5 concentrations. Data from the Copernicus Atmosphere Monitoring Service, Ozone Monitoring Instrument (OMI), land use and meteorological variables were included to estimate daily NO2 concentrations. To downscale satellite data and incorporate local sources, a multistage framework with mixed‐effect and random forest models was applied. With these models, over 70% of the NO2 variation can be explained. 34 Consistent with the pollen exposure, 7‐day averages of PM2.5 and NO2 were calculated for the week prior to each telephone interview.
2.3.3. Meteorological variables
Daily average temperature at a 100 100 m resolution was obtained from a spatiotemporal model described in detail elsewhere. 36 In summary, variations in ground‐based air temperature data from measurement stations operated by MeteoSwiss were explained in a random forest framework using a range of predictor variables. This included satellite‐derived Moderate Resolution Imaging Spectroradiometer (MODIS) land surface temperature, satellite‐derived Normalized Difference Vegetation Index (NDVI), elevation, land use, and meteorological data. A 7‐day average of temperature was then calculated for the week preceding the telephone interview. Weekly average relative humidity was assigned from the meteorological station closest to the infant's residential address.
2.4. Risk factors
The following data on known perinatal, hereditary, and environmental risk factors for respiratory morbidity were derived from hospital records, questionnaires, and weekly telephone interviews: sex, 27 siblings, 37 childcare, 37 maternal education, 38 maternal atopy, 27 , 39 maternal smoking during pregnancy, 37 cats, 40 dogs, 41 breastfeeding (any breastfeeding/no breastfeeding), 37 delivery mode, 42 age, 37 birthweight, 43 and season of birth. 44
2.5. Statistical analysis
The association of pollen exposure with daytime and nighttime respiratory symptom scores was assessed using generalized additive mixed models (GAMMs) with quasi‐Poisson distribution. GAMMs provide a general framework for extending linear mixed models. They allow the assessment of nonlinear relationships between exposure and outcome by using smooth functions. 45 Random effect and autoregressive correlation structure (lag 1) were employed to account for temporal correlation of respiratory symptoms within each subject. Estimates are expressed as risk ratios (RRs) per 10% increase in pollen/m3 (RR = 1.10β). An RR of 1.006 can be interpreted as a 0.6% increase in respiratory symptom score for an increase in pollen concentration by 10%. Separate models were built for combined, tree, and grass pollen. All models were adjusted for a priori selected risk factors identified in previous studies of this cohort 19 , 27 , 37 : PM2.5, NO2, siblings, childcare, sex, breastfeeding, age, maternal smoking during pregnancy, temperature, and month (to control for seasonal variation of respiratory symptoms) (Figure 1). In addition, models (except combined pollen models) were mutually adjusted for tree pollen and grass pollen. Pollen groups and covariates were included as smoothing terms in case of a nonlinear relationship with respiratory symptom scores. If a nonlinear relationship has been identified, the sample was restricted to the range of pollen concentrations linearly associated with the outcome in order to obtain interpretable coefficient estimates.
FIGURE 1.
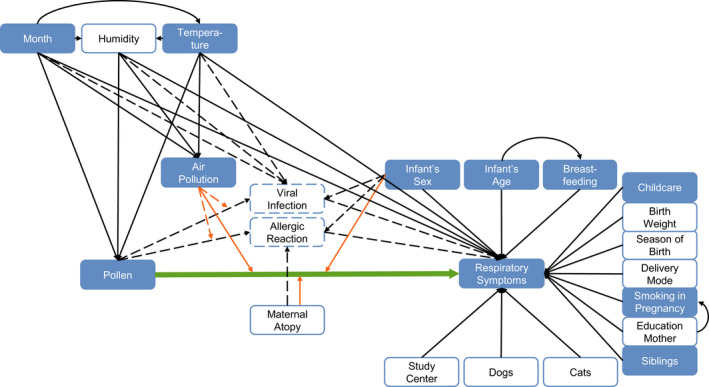
Directed acyclic graph (DAG) of the association between pollen exposure and respiratory symptoms during the first year of life. Exposure of interest and outcome are connected with a bold arrow. Dashed arrows show unobserved associations, and solid arrows show observed associations. Orange arrows represent potential effect modifications. Filled boxes are covariates included in the main models. Clear boxes with a solid outline are covariates additionally included for the sensitivity analysis. Boxes with a dashed outline show unobserved variables
To evaluate effect modification by maternal atopy or infant's sex, separate models including factor‐smooth interaction terms were fitted. In order to assess effect modification by NO2 and PM2.5, separate models were fitted including tensor product interaction terms (ti).
In addition, three sensitivity analyses were performed. First, the association between pollen and respiratory symptoms was investigated considering additional risk factors: cat, dog, delivery mode, birthweight, maternal education, maternal atopy, season of birth, study center (to control for intercenter differences), and relative humidity (Figure 1). Second, the sample was restricted to observations collected after six months of age, to evaluate the effect of pollen on respiratory symptoms in the absence of maternal IgE in the infant's blood. 46 , 47 Third, we assessed the association of combined, tree, and grass pollen with respiratory symptoms without restricting the analyzed time period to months with >0.1 pollen/m3. This was to evaluate whether the inclusion of several days with zero pollen impacts the results.
Data preprocessing and descriptive statistics were performed with STATA (version 16.1; STATA Corp, Texas). GAMMs were executed in R (version 4.0.3). 48
3. RESULTS
3.1. Study population
We included in total 401 term‐born infants with complete data for 14,874 measurement time points to analyze the association between pollen and respiratory symptoms during the first year of life (Figure S1). Details on the study population are outlined in Table 1.
TABLE 1.
Characteristics of the study population
| Sample size, n | 401 |
| Anthropometrics | |
| Boys, n (%) | 201 (50) |
| Gestational age at birth in weeks, mean ± SD | 39.67 ± 1.12 |
| Birthweight in kg, mean ± SD | 3.37 ± 0.45 |
| Risk factors | |
| Any breastfeeding in 1st year of life, n (%) | 397 (99) |
| Weeks with any breastfeeding in 1st year of life, mean ± SD | 33.52 ± 14.52 |
| Presence of siblings, n (%) | 215 (54) |
| Childcare in 1st yr of life, n (%) | 133 (33) |
| Maternal smoking in pregnancy, n (%) | 16 (4) |
| Education mother a , n (%) | |
| Low | 62 (15) |
| Middle | 123 (31) |
| High | 216 (54) |
| Cesarean section, n (%) | 89 (22) |
| Maternal atopy, n (%) | 128 (32) |
| Cats at home, n (%) | 61 (15) |
| Dogs at home, n (%) | 20 (5) |
| Season of birth b | |
| Winter (December–February), n (%) | 89 (22) |
| Spring (March–May), n (%) | 103 (26) |
| Summer (July–August), n (%) | 108 (27) |
| Autumn (September–November), n (%) | 101 (25) |
| Respiratory symptoms c | |
| Daytime symptom score, mean ± SD | 0.13 ± 0.13 |
| Nighttime symptom score, mean ± SD | 0.12 ± 0.14 |
| Weeks with daytime symptoms, mean ± SD d | 3.92 ± 3.77 |
| Weeks with nighttime symptoms, mean ± SD d | 3.03 ± 3.01 |
Low: < 4 years apprenticeship, middle: ≥ 4 years apprenticeship, and high: tertiary education.
Meteorological season.
Assessed from January through September.
Weeks with respiratory symptom score ≥ 1.
Respiratory symptom scores were overall low (Table 1 and Table S2). The mean ± SD symptom score from January through September across all years was 0.13 ± 0.13 for daytime respiratory symptoms and 0.12 ± 0.14 for nighttime respiratory symptoms. Within these months, infants on average ± SD had daytime respiratory symptoms for 3.92 ± 3.77 weeks and nighttime respiratory symptoms during 3.03 ± 3.01 weeks. Temporal development and seasonal fluctuations in daytime respiratory symptom scores and pollen concentrations are shown in Figure 2. Analysis periods (months with mean pollen concentrations >0.1 pollen/m3) lasted from January through September for combined pollen, January through July for tree pollen, and April through September for grass pollen. Descriptive statistics for weekly pollen concentrations and other environmental exposures are given in Table 2 and Table S1.
FIGURE 2.
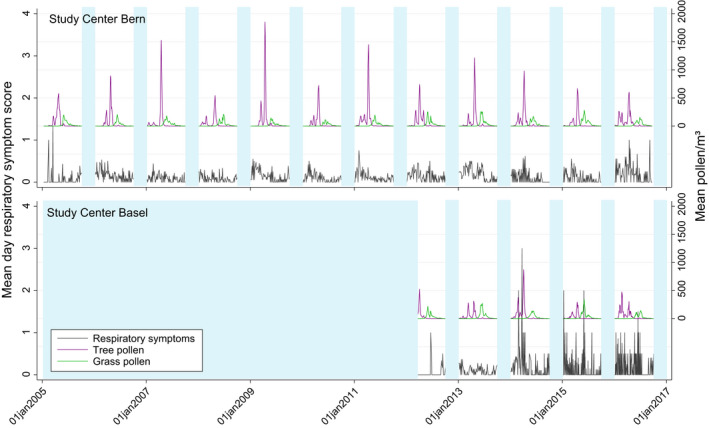
Temporal development and seasonal fluctuations of mean daytime respiratory symptom scores and mean pollen concentrations across study participants in Bern (January 2005 to January 2017) and Basel (March 2012 to January 2017). Areas shaded in light blue represent months excluded from the analysis due to missing data (no pollen data from October through December; start of cohort study in Basel in 2012)
TABLE 2.
Distribution of weekly pollen concentrations, air pollution, and meteorological conditions for the respective analysis period
| Combined pollen a | Tree pollen b | Grass pollen c | |||||||
|---|---|---|---|---|---|---|---|---|---|
| Mean±SD | Median | IQR | Mean±SD | Median | IQR | Mean±SD | Median | IQR | |
| Pollen (pollen/m3) | 77.4±137.7 | 24.3 | 73.0 | 71.2±195.1 | 5.6 | 50.7 | 32.7±50.8 | 10.0 | 38.6 |
| Air pollution (μg/m3) | |||||||||
| PM2.5 | 16.0±8.0 | 14.2 | 8.6 | 16.8±8.6 | 14.8 | 9.6 | 13.7±5.0 | 12.9 | 6.3 |
| NO2 | 19.0±11.4 | 16.9 | 16.0 | 20.2±11.9 | 18.4 | 16.9 | 14.6±8.5 | 13.0 | 11.9 |
| Relative humidity (%) | 72.1±8.7 | 72.3 | 11.7 | 71.6±9.1 | 71.9 | 12.8 | 70.0±8.3 | 70.4 | 11.4 |
| Temperature (°C) | 11.7±7.3 | 13.4 | 12.1 | 10.1±7.5 | 10.7 | 12.4 | 15.8±4.2 | 16.1 | 5.7 |
Months with mean combined pollen concentration (pollen/m3) >0.1: January through September.
Months with mean tree pollen concentration (pollen/m3) >0.1: January through July.
Months with mean grass pollen concentration (pollen/m3) >0.1: April through September.
3.2. Association between pollen and respiratory symptoms
We found that exposure to combined pollen, as well as tree and grass pollen separately, was associated with respiratory symptoms during the first year of life. Results for each pollen group are summarized in Figure 3 and Table 3.
FIGURE 3.
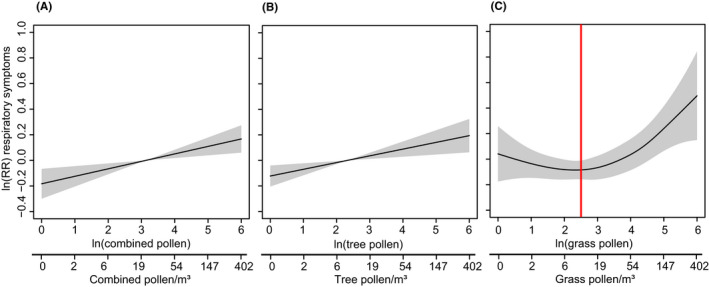
Marginal effects of pollen exposure on the risk of daytime respiratory symptoms (pollen exposure shown on ln scale and backtransformed scale: exp(ln)‐1). Shaded areas represent the 95% confidence interval. Models were adjusted for NO2, PM2.5, siblings, childcare, sex, breastfeeding, age, maternal smoking during pregnancy, temperature, and month. (A) Association between combined pollen and daytime respiratory symptoms. (B) Association between tree pollen and daytime respiratory symptoms. (C) Association between grass pollen and daytime respiratory symptoms. The red line indicates the cutoff used to assess the linear relationship between grass pollen and respiratory symptoms
TABLE 3.
Association of pollen exposure with respiratory symptom scores during infancy
| Daytime symptom score | Nighttime symptom score | |||||
|---|---|---|---|---|---|---|
| RR | 95% CI | p‐value | RR | 95% CI | p‐value | |
| Combined pollen (n=14,874) a | 1.006 | 1.002, 1.009 | 0.002 | 1.003 | 0.999, 1.007 | 0.170 |
| Tree pollen (n=11,483) a | 1.005 | 1.002, 1.008 | 0.003 | 1.003 | 0.999, 1.007 | 0.088 |
| Grass pollen (n=5,047) b | 1.009 | 1.000, 1.018 | 0.049 | 1.014 | 1.004, 1.024 | 0.005 |
GAMM adjusted for NO2, PM2.5, siblings, childcare, sex, breastfeeding, age, maternal smoking during pregnancy, temperature, and month.
Risk ratio (RR) per 10% increase in pollen/m3: (1.10)β For example, an estimate of 1.006 can be interpreted as a 0.6% increase in respiratory symptom score for an increase in pollen concentration by 10%.
Risk ratio (RR) per 10% increase in pollen/m3: (1.10)β .Sample restricted to pollen concentrations (pollen/m3) >10.
An increase in combined pollen exposure was linearly associated with increased risk of daytime respiratory symptom scores (RR [95% CI] per 10% pollen/m3: 1.006 [1.002, 1.009]). Similarly, an increase in exposure to tree pollen was linearly associated with increased risk of daytime respiratory symptoms (RR [95% CI] per 10% pollen/m3: 1.005 [1.002, 1.008]). We identified a nonlinear relationship between grass pollen and daytime respiratory symptoms (Figure 3). For grass pollen concentrations <10 pollen/m3, we observed no association with respiratory symptoms, whereas the risk of respiratory symptoms increased linearly for pollen concentration >10 pollen/m3. After restricting the sample to grass pollen concentrations >10 pollen/m3 (5,047 observations), an increase in pollen was associated with increased risk of daytime respiratory symptoms (RR [95% CI] per 10% pollen/m3: 1.009 [1.000, 1.018]) and increased risk of nighttime respiratory symptoms (RR [95% CI] per 10% pollen/m3: 1.014 [1.004, 1.024]). No associations could be found for combined pollen and tree pollen with nighttime respiratory symptoms (Table 3).
In addition, we performed several interaction analyses to assess the effect modification by maternal atopy, infant's sex, and air pollution (PM2.5, NO2). We found no interaction between combined pollen and maternal atopy (Figure S2, upper panel). Furthermore, we found no interaction between combined pollen and infant's sex (Figure S2, lower panel). However, we found a complex crossover interaction between combined pollen and PM2.5 (p‐value 0.003) (Figure S3). Pollen had the opposite effect on daytime respiratory symptoms dependent on the level of PM2.5, although there was no main effect of PM2.5 (Table S3). We found no interactions between PM2.5 and tree pollen or grass pollen. Furthermore, we found no interactions between combined pollen, grass pollen or tree pollen, and NO2 (data not shown), although NO2 itself was positively associated with respiratory symptoms (Table S3).
3.3. Sensitivity analyses
The three sensitivity analyses confirmed the robustness of the observed association between pollen exposure and respiratory symptoms.
The models extended by additional covariates (Table S4), as well as those excluding observations collected before six months of age (Table S5) and those without restriction to months with mean pollen concentrations >0.1 pollen/m3 (Table S6), yielded comparable results to the main models.
4. DISCUSSION
This is the first longitudinal study to show novel surprising evidence that pollen exposure is associated with risk of respiratory symptoms in healthy infants. Interestingly, the effect of pollen was not enhanced by infant's sex and maternal atopy. Our results extend the findings of previous studies that show a positive association between pollen exposure and respiratory symptoms in older children and adults 1 , 2 , 3 to infancy, which is an important window of opportunity.
An increase in exposure to combined pollen, as well as to tree pollen and grass pollen separately, was associated with an increase in respiratory symptoms. This clearly agrees with our first hypothesis that pollen exposure—even as early as during the first year of life—is related to an increased risk of respiratory symptoms. The large number of observations enabled us to detect an association even when effect sizes were relatively small. The effect sizes identified herein are comparable to those previously reported for the association between pollen and lower respiratory tract symptoms in children and adults. 1 Because we have examined the association between pollen and lower respiratory tract symptoms (wheeze, cough, and dyspnea), the effects might be stronger for upper respiratory tract symptoms (e.g., rhinitis, sneezing, sore throat) typically evoked by pollen exposure in predisposed individuals. 1
Until now, it was assumed that pollen‐related allergic respiratory symptoms rarely occur in infants because sensitization to pollen usually develops after the first year of life. 49 , 50 , 51 It has been found that allergen‐specific IgE in cord blood 46 and in neonates 47 is most likely a result of a transfer of maternal IgE to the fetus and does not indicate a sensitization of the fetus or the infant itself. 46 To reduce the possibility of contamination by maternal IgE, we excluded observations from the first six months of life. Doing so, we again found a significant association between pollen and respiratory symptoms. This finding increases the likelihood that respiratory symptoms result from a pollen sensitization of the infant itself. Yet, contrary to what would be expected for sensitized infants, we found no effect modification by maternal atopy. To further clarify whether respiratory symptoms are related to a pollen sensitization and whether maternal allergy status modifies an allergic reaction of the child, additional data on maternal and offspring IgE levels would be needed.
In our case, the observed respiratory symptoms may also reflect a nonallergic response to a viral infection. This is supported by the study of Gilles et al., which suggests that pollen suppresses antiviral immunity by downregulation of type I and III interferons in nasal mucosa, increasing the susceptibility to respiratory viral infections independent of sensitization. 2 Although our results suggest an overall effect of pollen, mediation analyses—including data for infant's sensitization status and viral infection—would be needed to evaluate the mechanisms underlying the association between pollen and respiratory symptoms. This may further help to elucidate the modifying effect of infant's sex. Previous studies have shown an increased risk of allergic respiratory symptoms 5 , 52 and higher susceptibility for respiratory infections 8 in boys than in girls. Therefore, we hypothesized that the effect of pollen on respiratory symptoms is enhanced in male infants. However, our results suggest that the demonstrated effect of pollen is not only independent of maternal atopy but also independent of the infant's sex. Moreover, air pollution did not clearly impact the effect of pollen, which disagrees with our second hypothesis. However, it supports the results from previous studies, which also found no significant interaction between pollen and air pollution in their association with respiratory symptoms or asthma hospital admissions. 53
4.1. Strengths and limitations
To the best of our knowledge, this is the first longitudinal study investigating the association between pollen and respiratory symptoms in healthy infants. One major strength of our study is the amount of observations (14,874) available to investigate the association between pollen and respiratory symptom scores. This large number of observations increases the possibility of capturing some variation between NO2 and PM2.5, which are obviously correlated as they are emitted by similar sources. However, the fact that background levels of NO2 and PM2.5 can vary regionally and temporally and that the pollutants have different health effects, limits their correlation. 9 , 10 Using a multipollutant model adjusted for several coexposures and including interactions, we follow the emerging exposome concept. 54 This approach is appropriate for the study of health outcomes that can be caused by a complex interaction between environmental, lifestyle, and genetic factors. 54 , 55 Our capability to control for major confounders increases the likelihood of detecting a marginal effect of pollen on respiratory symptoms. Among others, this includes the adjustment for temperature, humidity, and month of assessment, which are associated with both respiratory health and pollen concentrations. Cold temperatures and low humidity are associated with increased respiratory symptoms 56 , 57 and viral infections, 58 while warmer temperatures and low humidity are associated with increased pollen concentrations. 59 , 60 Because these meteorological variables correlate with seasonal viral infections, they serve us as surrogate control variables for the latter. By adjusting the models for the month of assessment, temperature, and humidity, we reduced the risk of confounding by pollen‐independent viral infections. Furthermore, the association we found between grass pollen and respiratory symptoms, using data from April through September, suggests that respiratory symptoms are not only driven by viruses and meteorological conditions typical for winter and early spring. This supports the novel evidence that pollen exposure is another risk factor for respiratory symptoms in healthy infants. Other strengths of our study include the prospective design, which reduces the risk of a recall bias, and the high‐quality exposure data (pollen, air pollution, temperature, and relative humidity) estimated for each interview time point and individual, increasing the accuracy of the association studied.
Limitations of this study include the use of 7‐day average respiratory symptom scores and the subsequent 7‐day averages for pollen exposure. This could result in blurring of the results, as pollen concentration varies from day to day and the effect of pollen on respiratory symptoms is generally expected within 1 day after exposure. 2 Additional blurring could emerge through the measurement error expected for Burkard traps. 61 Being aware of potential imprecision of our effect estimates, we have refrained from defining a threshold of minimum pollen concentration to cause respiratory symptoms. Other than that, due to its invasive assessment and limited resources, no data on sensitization to pollen or viral infections were obtained for this study. Such data would allow investigation of the underlying mechanisms of the association between pollen and respiratory symptoms. As with regard to our interaction analysis between air pollution and pollen, the relatively low variation of air pollution and respiratory symptoms within and between subjects should be considered. Besides the overall low effect sizes, this complicates the detection of an interaction effect. 62 Our results and the controversial evidence from previous studies both underpin the recognition that the assessment of an air pollution–pollen interaction in an epidemiological study is methodologically challenging. 53 In addition, spatiotemporal data were available for PM2.5 and NO2 only. Further studies are needed to evaluate the interaction between other relevant air pollutants (e.g., ozone, sulfur dioxide, and carbon monoxide) and pollen in their association with respiratory symptoms in infants.
5. CONCLUSIONS
In this study, we show first evidence that—even as early as during the first year of life—increased exposure to combined pollen and to tree and grass pollen separately is associated with increased respiratory symptoms. Importantly, we found that this is even the case in healthy term‐born infants. The association was independent of the atopic status of the mother and infant's sex. Because infancy is a particularly vulnerable period for lung development, the identified adverse effect of pollen exposure may be relevant to the evolvement of chronic childhood asthma. Additional larger studies including data on infant's sensitization status and presence of viral infections may help to further elucidate the underlying mechanisms of the association between pollen and respiratory symptoms.
CONFLICT OF INTERESTS
PL reports personal fees from OM Pharma, Polyphor, Santhera, Vertex, and Vifor, outside the submitted work. JU reports personal fees from Vertex outside the submitted work. OF reports personal fees from OM Pharma, Menarini, ALK, Vertex, Bencard, Medical Tribune, Milupa–Nutricia, Stallergenes Greer and aha! Allergie Zentrum outside the submitted work. The remaining authors declare no conflict of interest.
AUTHOR CONTRIBUTIONS
PL, UF, AG, OF, and JU designed the study. JU, FD, OG, YS, and SY assisted in the collection of the clinical and metadata. AG performed the data analysis and wrote the main manuscript with input from the coauthors. JU, OF, ME, OG, JJ, and UF contributed to the statistical interpretation of results. ME, RG, DV, and KdH provided the environmental exposure data and helped with the interpretation of the data. UF is the principal investigator of the BILD cohort. All authors read and approved the final manuscript.
Supporting information
Supplementary Material
ACKNOWLEDGMENTS
The authors thank the study participants, the BILD study group, and the BILD cohort team (University Children's Hospital Basel (UKBB), Switzerland; Division of Pediatric Respiratory Medicine and Allergology, Department of Pediatrics, Inselspital, Bern University Hospital, Switzerland), and Fiona Beck for editing the manuscript.
The data used in this study are part of the Basel‐Bern Infant Lung Development (BILD) cohort study, which is funded by the Swiss National Science Foundation (grant 320300_204717). AG is funded by the “Forschungsfond exzellenter Nachwuchsforschender” issued to JU. Open access funding provided by Universitat Basel. [Correction added on 14‐May‐2022, after first online publication: CSAL funding statement has been added.]
1.
Basel‐Bern Infant Lung Development (BILD) cohort, current study group: KeesHoogh, PhD, Basel; Fabienne Decrue, MD, PhD, Basel; Urs Frey, MD, PhD, Basel; Oliver Fuchs, MD, PhD, Bern; Amanda Gisler, Basel; Olga Gorlanova, MD, Basel; Anne‐Christiane Kentgens, MD, Bern; Insa Korten, MD, PhD, Bern; Johanna Kurz, Bern; Philipp Latzin, MD, PhD, Bern; Annika Nissen, Basel; Marc‐Alexander Oestreich, MD, Bern; Martin Röösli, PhD, Basel; Yasmin Salem, MD, Bern; Jakob Usemann, MD, PhD, Basel; Danielle Vienneau, PhD, Basel.
Gisler A, Eeftens M, de Hoogh K, et al; the BILD study group . Pollen exposure is associated with risk of respiratory symptoms during the first year of life. Allergy. 2022;77:3606–3616. doi: 10.1111/all.15284
Oliver Fuchs and Jakob Usemann made equal contribution.
BILD study group present in Appendix.
Contributor Information
Amanda Gisler, Email: amanda.gisler@ukbb.ch.
the BILD study group:
Kees Hoogh, Fabienne Decrue, Urs Frey, Oliver Fuchs, Amanda Gisler, Olga Gorlanova, Anne‐Christiane Kentgens, Insa Korten, Johanna Kurz, Philipp Latzin, Annika Nissen, Marc‐Alexander Oestreich, Martin Röösli, Yasmin Salem, Jakob Usemann, and Danielle Vienneau
REFERENCES
- 1. Kitinoja MA, Hugg TT, Siddika N, Rodriguez Yanez D, Jaakkola MS, Jaakkola JJK. Short‐term exposure to pollen and the risk of allergic and asthmatic manifestations: a systematic review and meta‐analysis. BMJ Open. 2020;10(1):e029069. [DOI] [PMC free article] [PubMed] [Google Scholar]
- 2. Gilles S, Blume C, Wimmer M, et al. Pollen exposure weakens innate defense against respiratory viruses. Allergy. 2020;75(3):576‐587. [DOI] [PubMed] [Google Scholar]
- 3. Gökkaya M, Damialis A, Nussbaumer T, et al. Defining biomarkers to predict symptoms in subjects with and without allergy under natural pollen exposure. J Allergy Clin Immunol. 2020;146(3):583‐594.e586. [DOI] [PubMed] [Google Scholar]
- 4. Damialis A, Gilles S, Sofiev M, et al. Higher airborne pollen concentrations correlated with increased SARS‐CoV‐2 infection rates, as evidenced from 31 countries across the globe. Proc Natl Acad Sci USA. 2021;118(12):e2019034118. [DOI] [PMC free article] [PubMed] [Google Scholar]
- 5. Melén E, Bergström A, Kull I, et al. Male sex is strongly associated with IgE‐sensitization to airborne but not food allergens: results up to age 24 years from the BAMSE birth cohort. Clin Trans Allergy. 2020;10(1):15. [DOI] [PMC free article] [PubMed] [Google Scholar]
- 6. Huurre A, Laitinen K, Rautava S, Korkeamäki M, Isolauri E. Impact of maternal atopy and probiotic supplementation during pregnancy on infant sensitization: a double‐blind placebo‐controlled study. Clin Exp Allergy. 2008;38(8):1342‐1348. [DOI] [PubMed] [Google Scholar]
- 7. Wu CC, Chen RF, Kuo HC. Different implications of paternal and maternal atopy for perinatal IgE production and asthma development. Clin Dev Immunol. 2012;2012:132142. [DOI] [PMC free article] [PubMed] [Google Scholar]
- 8. Ben‐Shmuel A, Sheiner E, Wainstock T, Landau D, Vaknin F, Walfisch A. The association between gender and pediatric respiratory morbidity. Pediatr Pulmonol. 2018;53(9):1225‐1230. [DOI] [PubMed] [Google Scholar]
- 9. Senechal H, Visez N, Charpin D, et al. A review of the effects of major atmospheric pollutants on pollen grains, pollen content, and allergenicity. Sci World J. 2015;2015:940243. [DOI] [PMC free article] [PubMed] [Google Scholar]
- 10. Ormstad H. Suspended particulate matter in indoor air: adjuvants and allergen carriers. Toxicology. 2000;152(1–3):53‐68. [DOI] [PubMed] [Google Scholar]
- 11. Bauer RN, Diaz‐Sanchez D, Jaspers I. Effects of air pollutants on innate immunity: the role of Toll‐like receptors and nucleotide‐binding oligomerization domain‐like receptors. J Allergy Clin Immunol. 2012;129(1):14‐26. [DOI] [PMC free article] [PubMed] [Google Scholar]
- 12. Glencross DA, Ho T‐R, Camiña N, Hawrylowicz CM, Pfeffer PE. Air pollution and its effects on the immune system. Free Radic Biol Med. 2020;151:56‐68. [DOI] [PubMed] [Google Scholar]
- 13. Cao Y, Chen M, Dong D, Xie S, Liu M. Environmental pollutants damage airway epithelial cell cilia: Implications for the prevention of obstructive lung diseases. Thorac Cancer. 2020;11(3):505‐510. [DOI] [PMC free article] [PubMed] [Google Scholar]
- 14. Xian M, Ma S, Wang K, et al. Particulate matter 2.5 causes deficiency in barrier integrity in human nasal epithelial cells. Allergy Asthma Immunol Res. 2020;12(1):56‐71. [DOI] [PMC free article] [PubMed] [Google Scholar]
- 15. Morgan WJ, Martinez FD. Risk factors for developing wheezing and asthma in childhood. Pediatr Clin North Am. 1992;39(6):1185‐1203. [DOI] [PubMed] [Google Scholar]
- 16. Delacourt C, Labbé D, Vassault A, Brunet‐Langot D, de Blic J, Scheinmann P. Sensitization to inhalant allergens in wheezing infants is predictive of the development of infantile asthma. Allergy. 1994;49(10):843‐847. [DOI] [PubMed] [Google Scholar]
- 17. Usemann J, Xu B, Delgado‐Eckert E, et al. Dynamics of respiratory symptoms during infancy and associations with wheezing at school age. ERJ Open Res. 2018;4(4):00037‐02018. [DOI] [PMC free article] [PubMed] [Google Scholar]
- 18. Holt PG, Sly PD. Viral infections and atopy in asthma pathogenesis: new rationales for asthma prevention and treatment. Nat Med. 2012;18(5):726‐735. [DOI] [PubMed] [Google Scholar]
- 19. Stern G, Latzin P, Roosli M, et al. A prospective study of the impact of air pollution on respiratory symptoms and infections in infants. Am J Respir Crit Care Med. 2013;187(12):1341‐1348. [DOI] [PubMed] [Google Scholar]
- 20. Postma DS, Bush A, van den Berge M. Risk factors and early origins of chronic obstructive pulmonary disease. Lancet. 2015;385(9971):899‐909. [DOI] [PubMed] [Google Scholar]
- 21. Usemann J, Decrue F, Korten I, et al. Exposure to moderate air pollution and associations with lung function at school‐age: a birth cohort study. Environ Int. 2019;126:682‐689. [DOI] [PubMed] [Google Scholar]
- 22. World Health Organization (WHO) . Prevalence of asthma and allergies in children. 2007; https://www.euro.who.int/__data/assets/pdf_file/0012/96996/3.1.pdf
- 23. Gisler A. Allergies in urban areas on the rise: the combined effect of air pollution and pollen. International Journal of Public Health. 2021;66(42):1‐2. [DOI] [PMC free article] [PubMed] [Google Scholar]
- 24. Glick S, Gehrig R, Eeftens M. Multi‐decade changes in pollen season onset, duration, and intensity: a concern for public health? Sci Total Environ. 2021;781:146382. [DOI] [PMC free article] [PubMed] [Google Scholar]
- 25. D’Amato G, Akdis CA. Global warming, climate change, air pollution and allergies. Allergy. 2020;75(9):2158‐2160. [DOI] [PubMed] [Google Scholar]
- 26. Fuchs O, Latzin P, Kuehni CE, Frey U. Cohort profile: the Bern infant lung development cohort. Int J Epidemiol. 2012;41(2):366‐376. [DOI] [PMC free article] [PubMed] [Google Scholar]
- 27. Latzin P, Frey U, Roiha HL, et al. Prospectively assessed incidence, severity, and determinants of respiratory symptoms in the first year of life. Pediatr Pulmonol. 2007;42(1):41‐50. [DOI] [PubMed] [Google Scholar]
- 28. Silverman M, Wang M, Hunter G, Taub N. Episodic viral wheeze in preschool children: effect of topical nasal corticosteroid prophylaxis. Thorax. 2003;58(5):431‐434. [DOI] [PMC free article] [PubMed] [Google Scholar]
- 29. Gehrig R, Maurer F, Schwierz C. Designing new automatically generated pollen calendars for the public in Switzerland. Aerobiologia. 2018;34(3):349‐362. [Google Scholar]
- 30. Darrow LA, Hess J, Rogers CA, Tolbert PE, Klein M, Sarnat SE. Ambient pollen concentrations and emergency department visits for asthma and wheeze. Journal of Allergy and Clinical Immunology. 2012;130(3):630‐638.e634. [DOI] [PMC free article] [PubMed] [Google Scholar]
- 31. Dales RE, Cakmak S, Judek S, et al. Influence of outdoor aeroallergens on hospitalization for asthma in Canada. Journal of Allergy and Clinical Immunology. 2004;113(2):303‐306. [DOI] [PubMed] [Google Scholar]
- 32. Lambert KA, Lodge C, Lowe AJ, et al. Pollen exposure at birth and adolescent lung function, and modification by residential greenness. Allergy. 2019;74(10):1977‐1984. [DOI] [PubMed] [Google Scholar]
- 33. Goodman JE, Loftus CT, Liu X, Zu K. Impact of respiratory infections, outdoor pollen, and socioeconomic status on associations between air pollutants and pediatric asthma hospital admissions. PLoS One. 2017;12(7):e0180522. [DOI] [PMC free article] [PubMed] [Google Scholar]
- 34. de Hoogh K, Saucy A, Shtein A, et al. Predicting fine‐scale daily NO2 for 2005–2016 incorporating OMI satellite data across Switzerland. Environ Sci Technol. 2019;53(17):10279‐10287. [DOI] [PubMed] [Google Scholar]
- 35. de Hoogh K, Heritier H, Stafoggia M, Kunzli N, Kloog I. Modelling daily PM2.5 concentrations at high spatio‐temporal resolution across Switzerland. Environ Pollut. 2018;233:1147‐1154. [DOI] [PubMed] [Google Scholar]
- 36. Flückiger B, Kloog I, Ragettli MS, Eeftens MR, öösli M, de Hoogh K. Modelling daily air temperature at a fine spatial resolution dealing with challenging meteorological phenomena and topography in Switzerland. International Journal of Climatology. (in press).
- 37. Gorlanova O, Thalmann S, Proietti E, et al. Effects of breastfeeding on respiratory symptoms in infancy. The Journal of Pediatrics. 2016;174:111‐117.e115. [DOI] [PubMed] [Google Scholar]
- 38. Spencer N. Maternal education, lone parenthood, material hardship, maternal smoking, and longstanding respiratory problems in childhood: testing a hierarchical conceptual framework. J Epidemiol Community Health. 2005;59(10):842‐846. [DOI] [PMC free article] [PubMed] [Google Scholar]
- 39. Carroll KN, Gebretsadik T, Minton P, et al. Influence of maternal asthma on the cause and severity of infant acute respiratory tract infections. J Allergy Clin Immunol. 2012;129(5):1236‐1242. [DOI] [PMC free article] [PubMed] [Google Scholar]
- 40. Lombardi E, Simoni M, La Grutta S, et al. Effects of pet exposure in the first year of life on respiratory and allergic symptoms in 7‐yr‐old children. The SIDRIA‐2 study. Pediatr Allergy Immunol. 2010;21(2 Pt 1):268‐276. [DOI] [PubMed] [Google Scholar]
- 41. Bergroth E, Remes S, Pekkanen J, Kauppila T, Büchele G, Keski‐Nisula L. Respiratory tract illnesses during the first year of life: effect of dog and cat contacts. Pediatrics. 2012;130(2):211‐220. [DOI] [PubMed] [Google Scholar]
- 42. Hansen AK, Wisborg K, Uldbjerg N, Henriksen TB. Risk of respiratory morbidity in term infants delivered by elective caesarean section: Cohort study. BMJ. 2008;336(7635):85‐87. [DOI] [PMC free article] [PubMed] [Google Scholar]
- 43. Davidson R, Roberts SE, Wotton CJ, Goldacre MJ. Influence of maternal and perinatal factors on subsequent hospitalisation for asthma in children: evidence from the Oxford record linkage study. BMC Pulm Med. 2010;10:14. [DOI] [PMC free article] [PubMed] [Google Scholar]
- 44. Almqvist C, Ekberg S, Rhedin S, Fang F, Fall T, Lundholm C. Season of birth, childhood asthma and allergy in a nationwide cohort‐Mediation through lower respiratory infections. Clin Exp Allergy. 2020;50(2):222‐230. [DOI] [PubMed] [Google Scholar]
- 45. Wood S. Generalized Additive Models: An Introduction with R, 2nd. 2nd ed. CRC Press; 2017. [Google Scholar]
- 46. Bønnelykke K, Pipper CB, Bisgaard H. Sensitization does not develop in utero. J Allergy Clin Immunol. 2008;121(3):646‐651. [DOI] [PubMed] [Google Scholar]
- 47. Lilja G, Johansson SG, Kusoffsky E, Oman H. IgE levels in cord blood and at 4–5 days of age: relation to clinical symptoms of atopic disease up to 18 months of age. Allergy. 1990;45(6):436‐444. [DOI] [PubMed] [Google Scholar]
- 48. R Core Team . R: A language and environment for statistical computing . R Foundation for Statistical Computing. [Google Scholar]
- 49. Kulig M, Bergmann R, Klettke U, Wahn V, Tacke U, Wahn U. Natural course of sensitization to food and inhalant allergens during the first 6 years of life. J Allergy Clin Immunol. 1999;103(6):1173‐1179. [DOI] [PubMed] [Google Scholar]
- 50. Ogershok PR, Warner DJ, Hogan MB, Wilson NW. Prevalence of pollen sensitization in younger children who have asthma. Allergy Asthma Proc. 2007;28(6):654‐658. [DOI] [PubMed] [Google Scholar]
- 51. LeMasters GK, Wilson K, Levin L, et al. High prevalence of aeroallergen sensitization among infants of atopic parents. J Pediat. 2006;149(4):505‐511. [DOI] [PMC free article] [PubMed] [Google Scholar]
- 52. Hohmann C, Keller T, Gehring U, et al. Sex‐specific incidence of asthma, rhinitis and respiratory multimorbidity before and after puberty onset: individual participant meta‐analysis of five birth cohorts collaborating in MeDALL. BMJ Open Respir Res. 2019;6(1):e000460. [DOI] [PMC free article] [PubMed] [Google Scholar]
- 53. Lam HCY, Jarvis D, Fuertes E. Interactive effects of allergens and air pollution on respiratory health: A systematic review. Sci Total Environ. 2021;757:143924. [DOI] [PMC free article] [PubMed] [Google Scholar]
- 54. Guillien A, Cadiou S, Slama R, Siroux V. The exposome approach to decipher the role of multiple environmental and lifestyle determinants in asthma. Int J Environment Res Public Health. 2021;18(3):1138. [DOI] [PMC free article] [PubMed] [Google Scholar]
- 55. Frey U, Usemann J. Addressing the complexity of prenatal and postnatal environmental exposures affecting childhood lung function. Lancet Planet Health. 2019;3(2):e51‐e52. [DOI] [PubMed] [Google Scholar]
- 56. Hyrkäs‐Palmu H, Ikäheimo TM, Laatikainen T, Jousilahti P, Jaakkola MS, Jaakkola JJK. Cold weather increases respiratory symptoms and functional disability especially among patients with asthma and allergic rhinitis. Sci Rep. 2018;8(1):10131. [DOI] [PMC free article] [PubMed] [Google Scholar]
- 57. Cruz AA, Togias A. Upper airways reactions to cold air. Curr Allergy Asthma Rep. 2008;8(2):111. [DOI] [PubMed] [Google Scholar]
- 58. Moriyama M, Hugentobler WJ, Iwasaki A. Seasonality of respiratory viral infections. Ann Rev Virol. 2020;7(1):83‐101. [DOI] [PubMed] [Google Scholar]
- 59. Jones AM, Harrison RM. The effects of meteorological factors on atmospheric bioaerosol concentrations—a review. Sci Total Environ. 2004;326(1):151‐180. [DOI] [PubMed] [Google Scholar]
- 60. Schramm PJ, Brown CL, Saha S, et al. A systematic review of the effects of temperature and precipitation on pollen concentrations and season timing, and implications for human health. Int J Biometeorol. 2021;65(10):1615‐1628. [DOI] [PMC free article] [PubMed] [Google Scholar]
- 61. Adamov S, Lemonis N, Clot B, et al. On the measurement uncertainty of Hirst‐type volumetric pollen and spore samplers. Aerobiologia. 2021;1‐15. [Google Scholar]
- 62. Schwartz J, Spix C, Touloumi G, et al. Methodological issues in studies of air pollution and daily counts of deaths or hospital admissions. J Epidemiol Community Health. 1996;50(Suppl 1):S3‐11. [DOI] [PMC free article] [PubMed] [Google Scholar]
Associated Data
This section collects any data citations, data availability statements, or supplementary materials included in this article.
Supplementary Materials
Supplementary Material