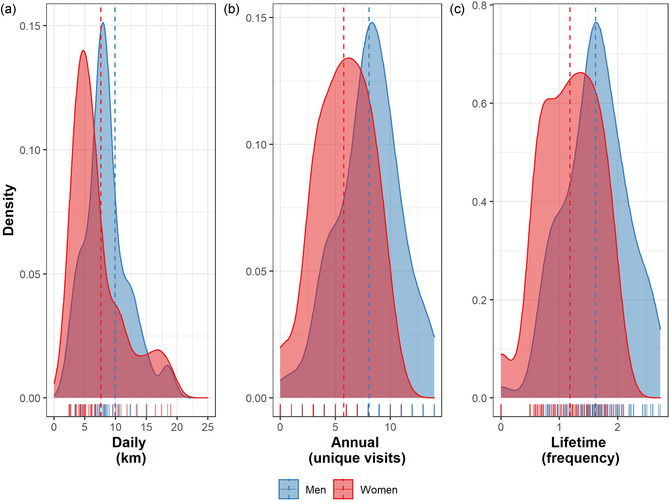
Fig. 3.

Mobility patterns. Density plots display distribution of men and women's (A) daily (B) annual, and (C) lifetime mobility. Dotted lines indicate the mean for men and women. Daily refers to average km traveled per day (by GPS), annual is full day or overnight visits to other villages in the past year, lifetime is an ordinal measure of lifetime travel over the region (see Methods). Rug marks on the X‐axis indicate the range of average daily travel (A) or unique responses (B, C) in the sample. Outliers (not shown here; N = 4) are included in the population means.
