Fig. 4.

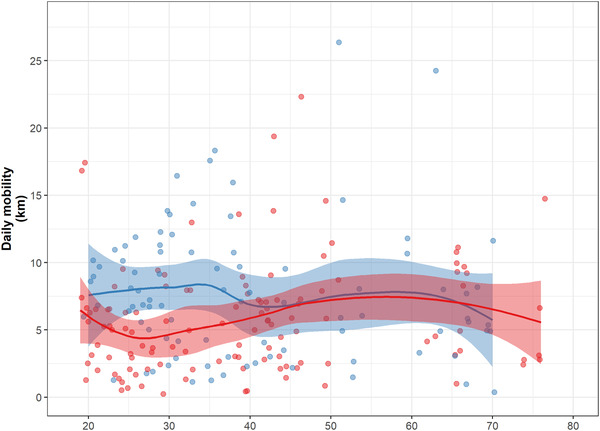
Average daily mobility for women and men. During the prime reproductive years, women appear to have lower daily mobility compared to men in the same age cohort (i.e., 20–39 years). Lines are smooth splines. Shaded areas represent 95% CIs.

Average daily mobility for women and men. During the prime reproductive years, women appear to have lower daily mobility compared to men in the same age cohort (i.e., 20–39 years). Lines are smooth splines. Shaded areas represent 95% CIs.