Fig. 6.

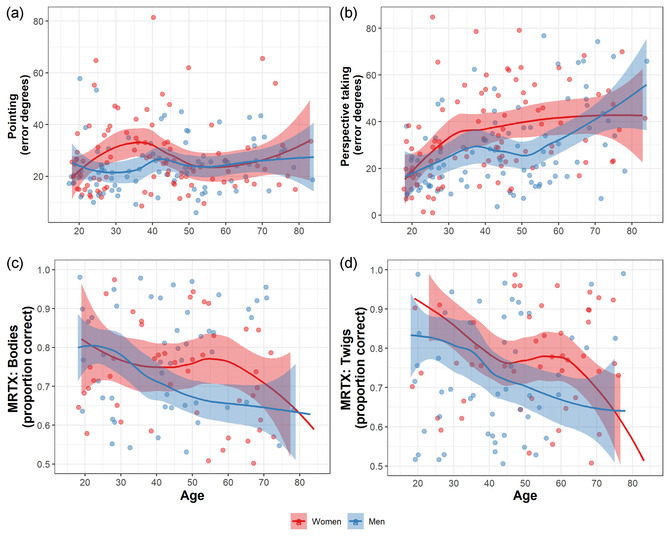
Scatterplots of (A) pointing error (N = 180), (B) perspective taking (N = 184), (C) MRTX: Bodies (N = 210), and (D) MRTX: Twigs (N = 207) by age and sex. All scatterplots are fitted with a smoothing spline. Shaded areas represent 95% CIs.

Scatterplots of (A) pointing error (N = 180), (B) perspective taking (N = 184), (C) MRTX: Bodies (N = 210), and (D) MRTX: Twigs (N = 207) by age and sex. All scatterplots are fitted with a smoothing spline. Shaded areas represent 95% CIs.