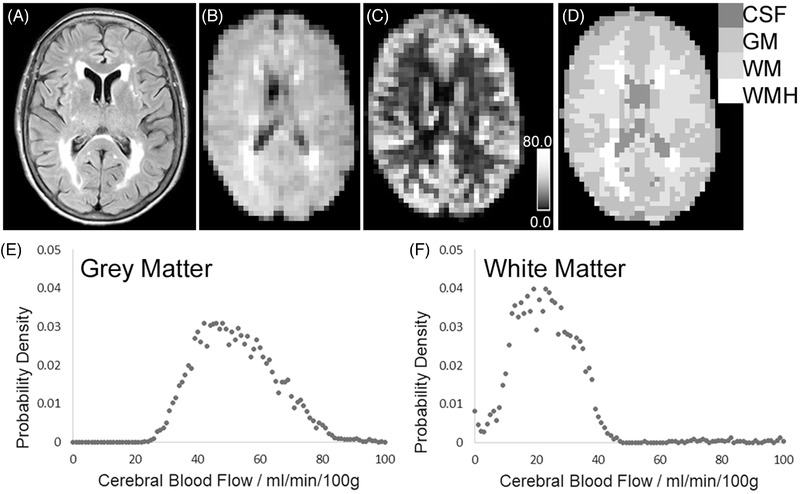
FIGURE 2.

Example of anatomical and cerebral blood flow (CBF) mapping, with tissue segmentation. A, Fluid‐attenuated inversion recovery (FLAIR) image at full resolution. B, FLAIR image co‐registered to the CBF map, with voxels re‐sized to be equivalent to the pseudo‐continuous arterial spin labelling (pCASL) map. C, CBF map, derived from pCASL. Calibration bar shows 0.0–80.0 mL/min/100 g. D, Tissue segmentation map for CBF computation. Each voxel has been defined as either: cerebrospinal fluid (CSF), gray matter (GM), normal‐appearing white matter (WM), or white matter hyperintensity (WMH). E, F, Probability density functions of CBF values in voxels assigned as gray matter (E) or normal‐appearing white matter (F). For this participant, median CBF was 51.3 mL/min/100 g in gray matter and 21.8 mL/min/100 g in normal‐appearing white matter
