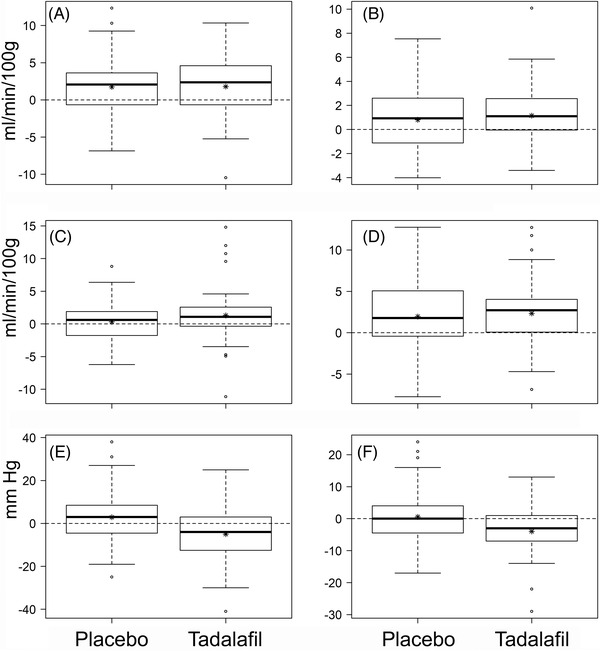
FIGURE 3.

Distributions of change (after–before) after placebo or tadalafil for cerebral blood flow (CBF) and blood pressure. A‐D, Change in CBF (mL/min/100 g) in deep gray nuclei (A), normal‐appearing white matter (B), white matter hyperintensities (C), and total gray matter (D). E,F, Change in systolic blood pressure (SBP; E) and diastolic blood pressure (DBP; F) (mmHg). Box‐whisker plots show median, interquartile range (IQR), and full range. Asterisks indicate mean values. For each of the parameters presented, mean values are listed in Table 2. Individual data points shown are > 3 IQR from the median
