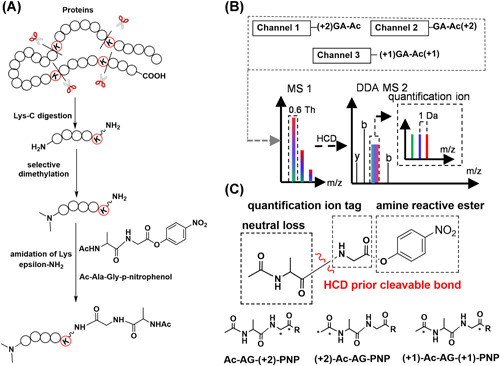
Figure 19.

Schematic view of the Ac‐AG approach. (A) Isobaric labeling steps; (B) LC‐MS of a mixture of triplex‐labeled samples in DDA mode; (C) Functional design of the triplex‐labeled Ac‐AG‐PNP tag (13C isotope locations are marked with asterisk) [Color figure can be viewed at wileyonlinelibrary.com]
