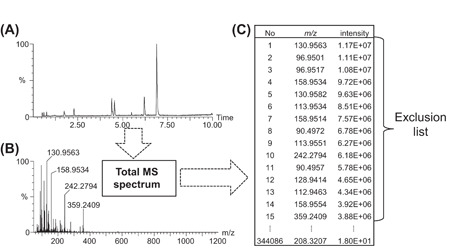
Figure 4.

Schematic representation of the creation of an exclusion list from a blank analysis. First, a blank sample is analysed. (A) The corresponding base peak intensity chromatogram. Second, a total MS spectrum is generated from the blank chromatogram (B). Third, a list of all detected peaks in this total MS spectrum is exported and sorted according to intensity (C). The exclusion list is created with the most intense background ions
