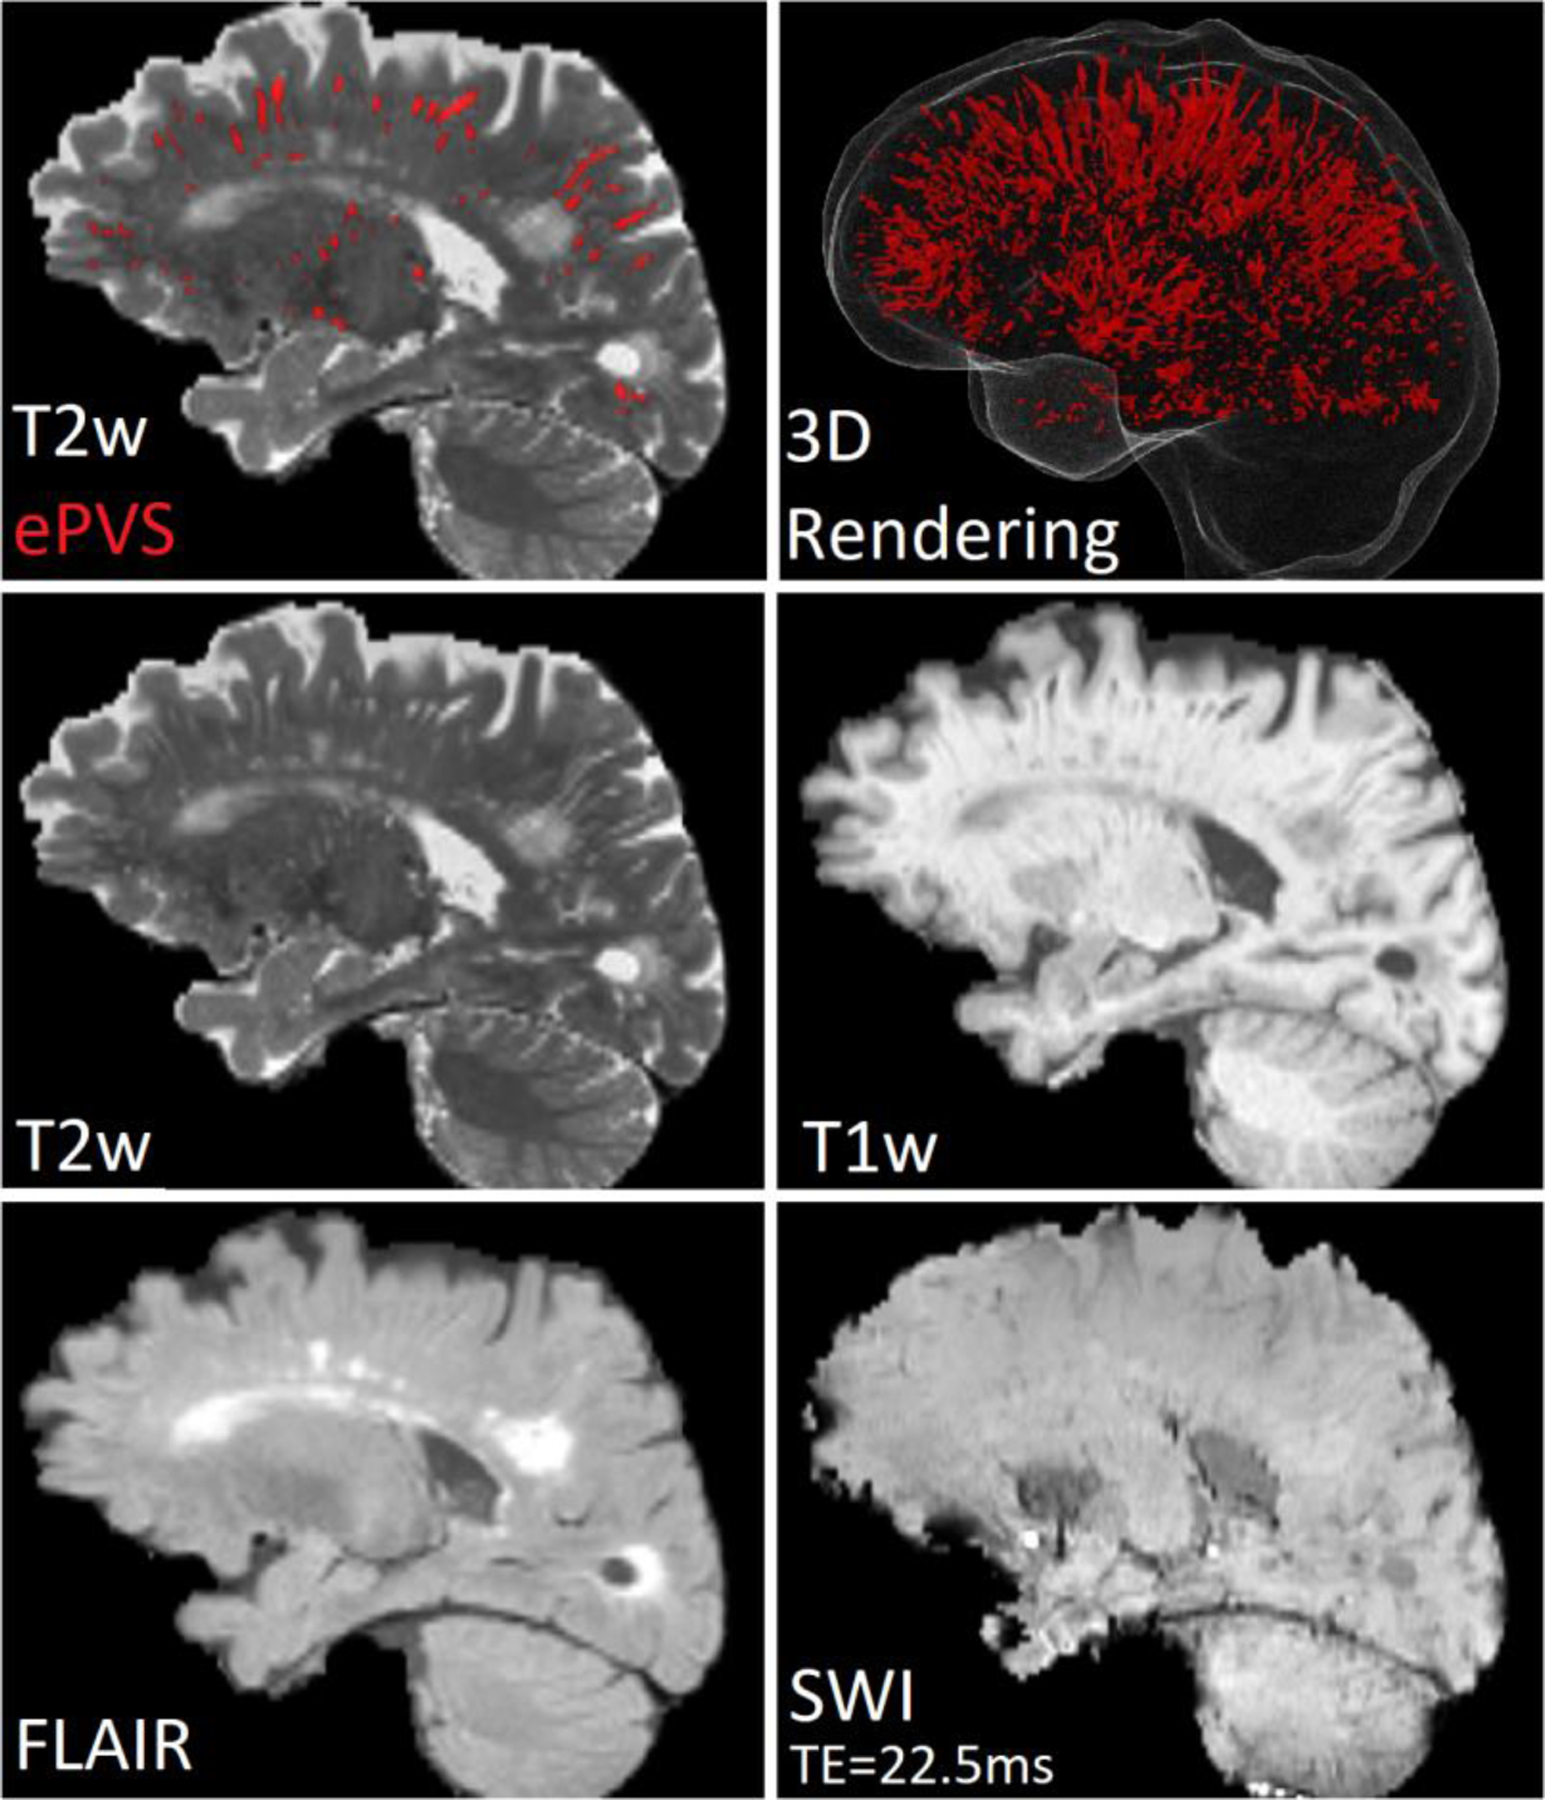
Fig. 2.

Examples of ePVS in different MRI sequences. From top to bottom and left to right: a) A T2w image with ePVS regions marked red. b) 3D rendering of ePVSs, which are marked red. c) The original T2w image without label. d) Corresponding T1w image. e) Corresponding FLAIR image. f) Corresponding SWI image when time of echo is 22.5ms.
