
Fig. 7.
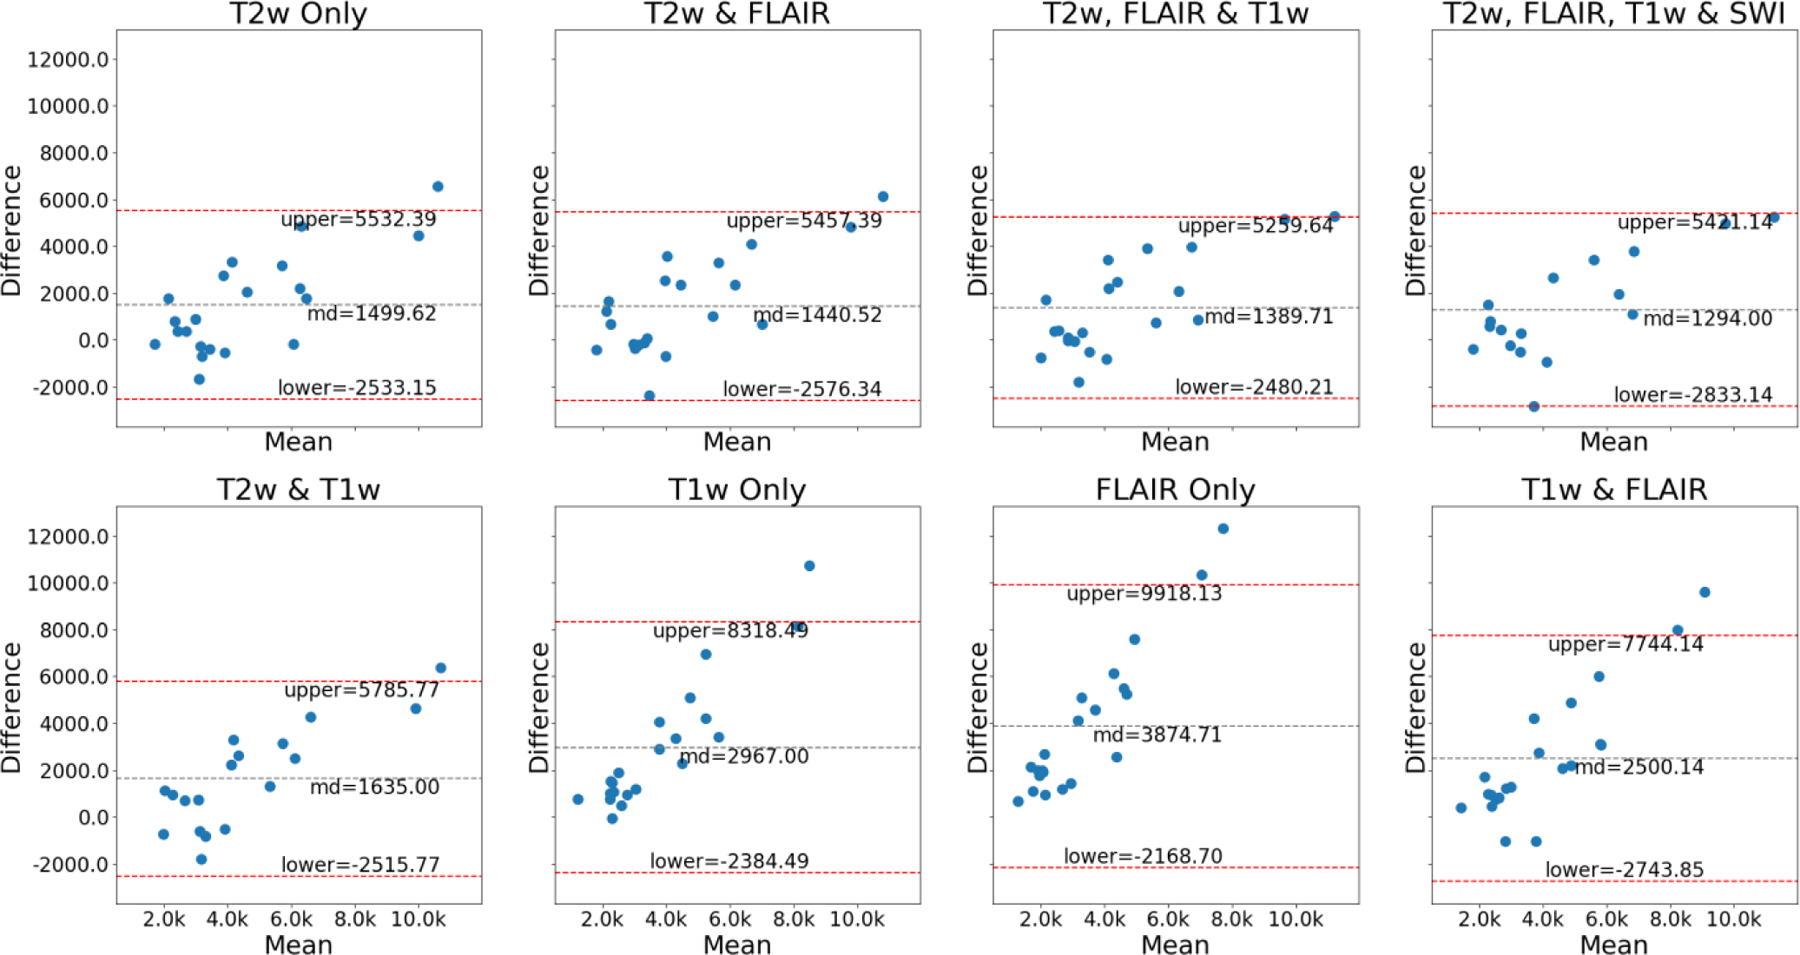
Bland-Altman plots of volume of of ePVS for different combinations of the sequences. The plots show the differences between the volumes of predicted ePVSs and those of the groundtruth ePVSs.
Official websites use .gov
A
.gov website belongs to an official
government organization in the United States.
Secure .gov websites use HTTPS
A lock (
) or https:// means you've safely
connected to the .gov website. Share sensitive
information only on official, secure websites.
Bland-Altman plots of volume of of ePVS for different combinations of the sequences. The plots show the differences between the volumes of predicted ePVSs and those of the groundtruth ePVSs.