
Figure 2.
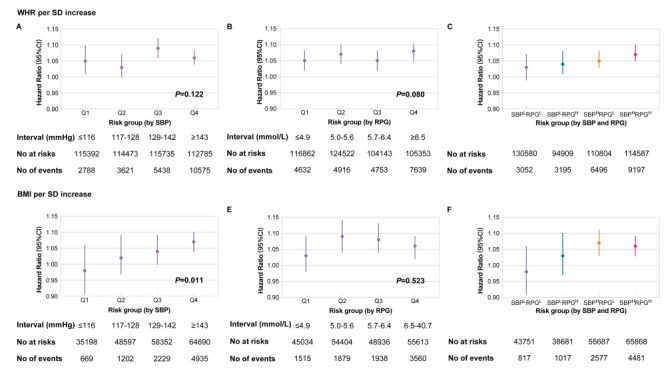
Risk for all-cause mortality per SD increase in WHR/BMI stratified by blood glucose and pressure in CKB. Panel A. Hazard ratio (95% CI) for all-cause mortality per SD increase in WHR stratified by quartiles of SBP. Panel B. Hazard ratio (95% CI) for all-cause mortality per SD increase in WHR stratified by quartiles of RPG. Panel C. Hazard ratio (95% CI) for all-cause mortality per SD increase in WHR stratified by a combination of SBP and RPG. Panel D. Hazard ratio (95% CI) for all-cause mortality per SD increase in BMI stratified by quartiles of SBP. Panel E. Hazard ratio (95% CI) for all-cause mortality per SD increase in BMI stratified by quartiles of RPG. Panel F. Hazard ratio (95% CI) for all-cause mortality per SD increase in BMI stratified by a combination of SBP and RPG. Hazard ratios were assessed by by Cox regression models adjusted for age, sex, region, education status, household income, current smoking, and alcohol drinking. P-values were estimated by comparing models adding an interaction term between risk group (as linear) and WHR/BMI against the original models, using the likelihood ratio test. Glucose or blood pressure intervals were defined as quartiles. Participants were divided into four groups using the median of SBP and RPG. SBP – systolic blood pressure, RPG – random plasma glucose, SBPLRPGL – SBP lower than the median and RPG lower than the median, SBPHRPGL – SBP higher than the median and RPG lower than the median, SBPLRPGH – SBP lower than the median and RPG higher than the median, SBPHRPGH – SBP higher than the median and RPG higher than the median.