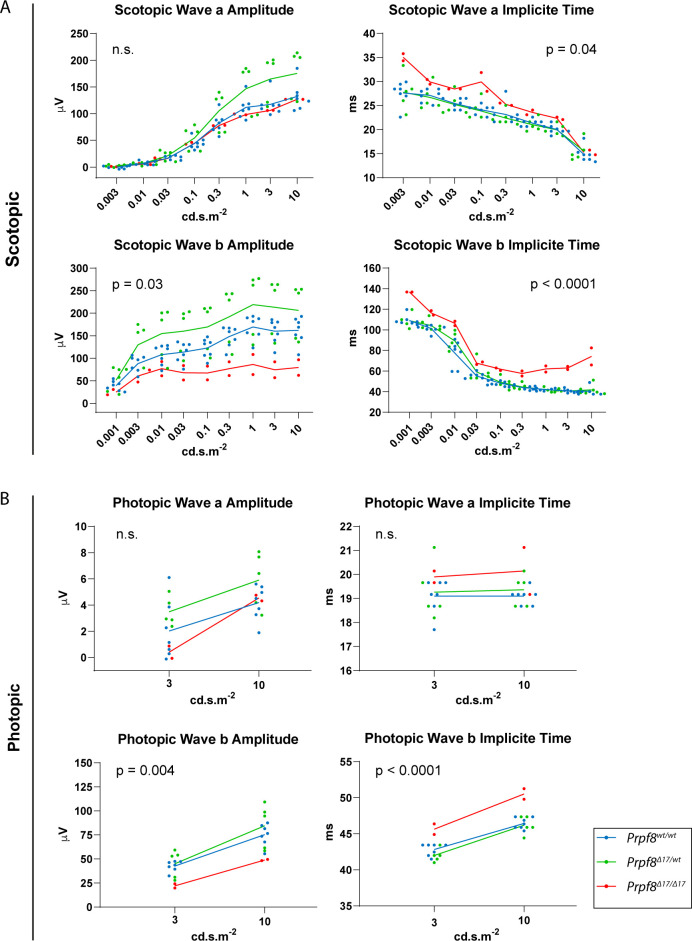
Figure S7. Scotopic and photopic electroretinography (ERG) examination of 22-wk-old mice of the Prpf8Δ17 strain.
(A, B) Scotopic (A) and photopic (B) ERG measurements. Luminance–response plots of full-field single-flash ERG for wave a are displayed in the top row, and for wave b in the second row. Values of amplitude and implicit time, respectively, were averaged between left and right eyes of each animal. Dots represent individual animals, and group averages of WT, heterozygous, and homozygous mutants are shown as connecting lines. P-values show a result of two-way ANOVA for the difference among groups. n = 5 for Prpf8wt/wt animals, n = 7 for Prpf8Δ17/wt, and n = 3 for Prpf8Δ17/Δ17 mice; results of one homozygous animal were removed from the analysis by outlier exclusion.

