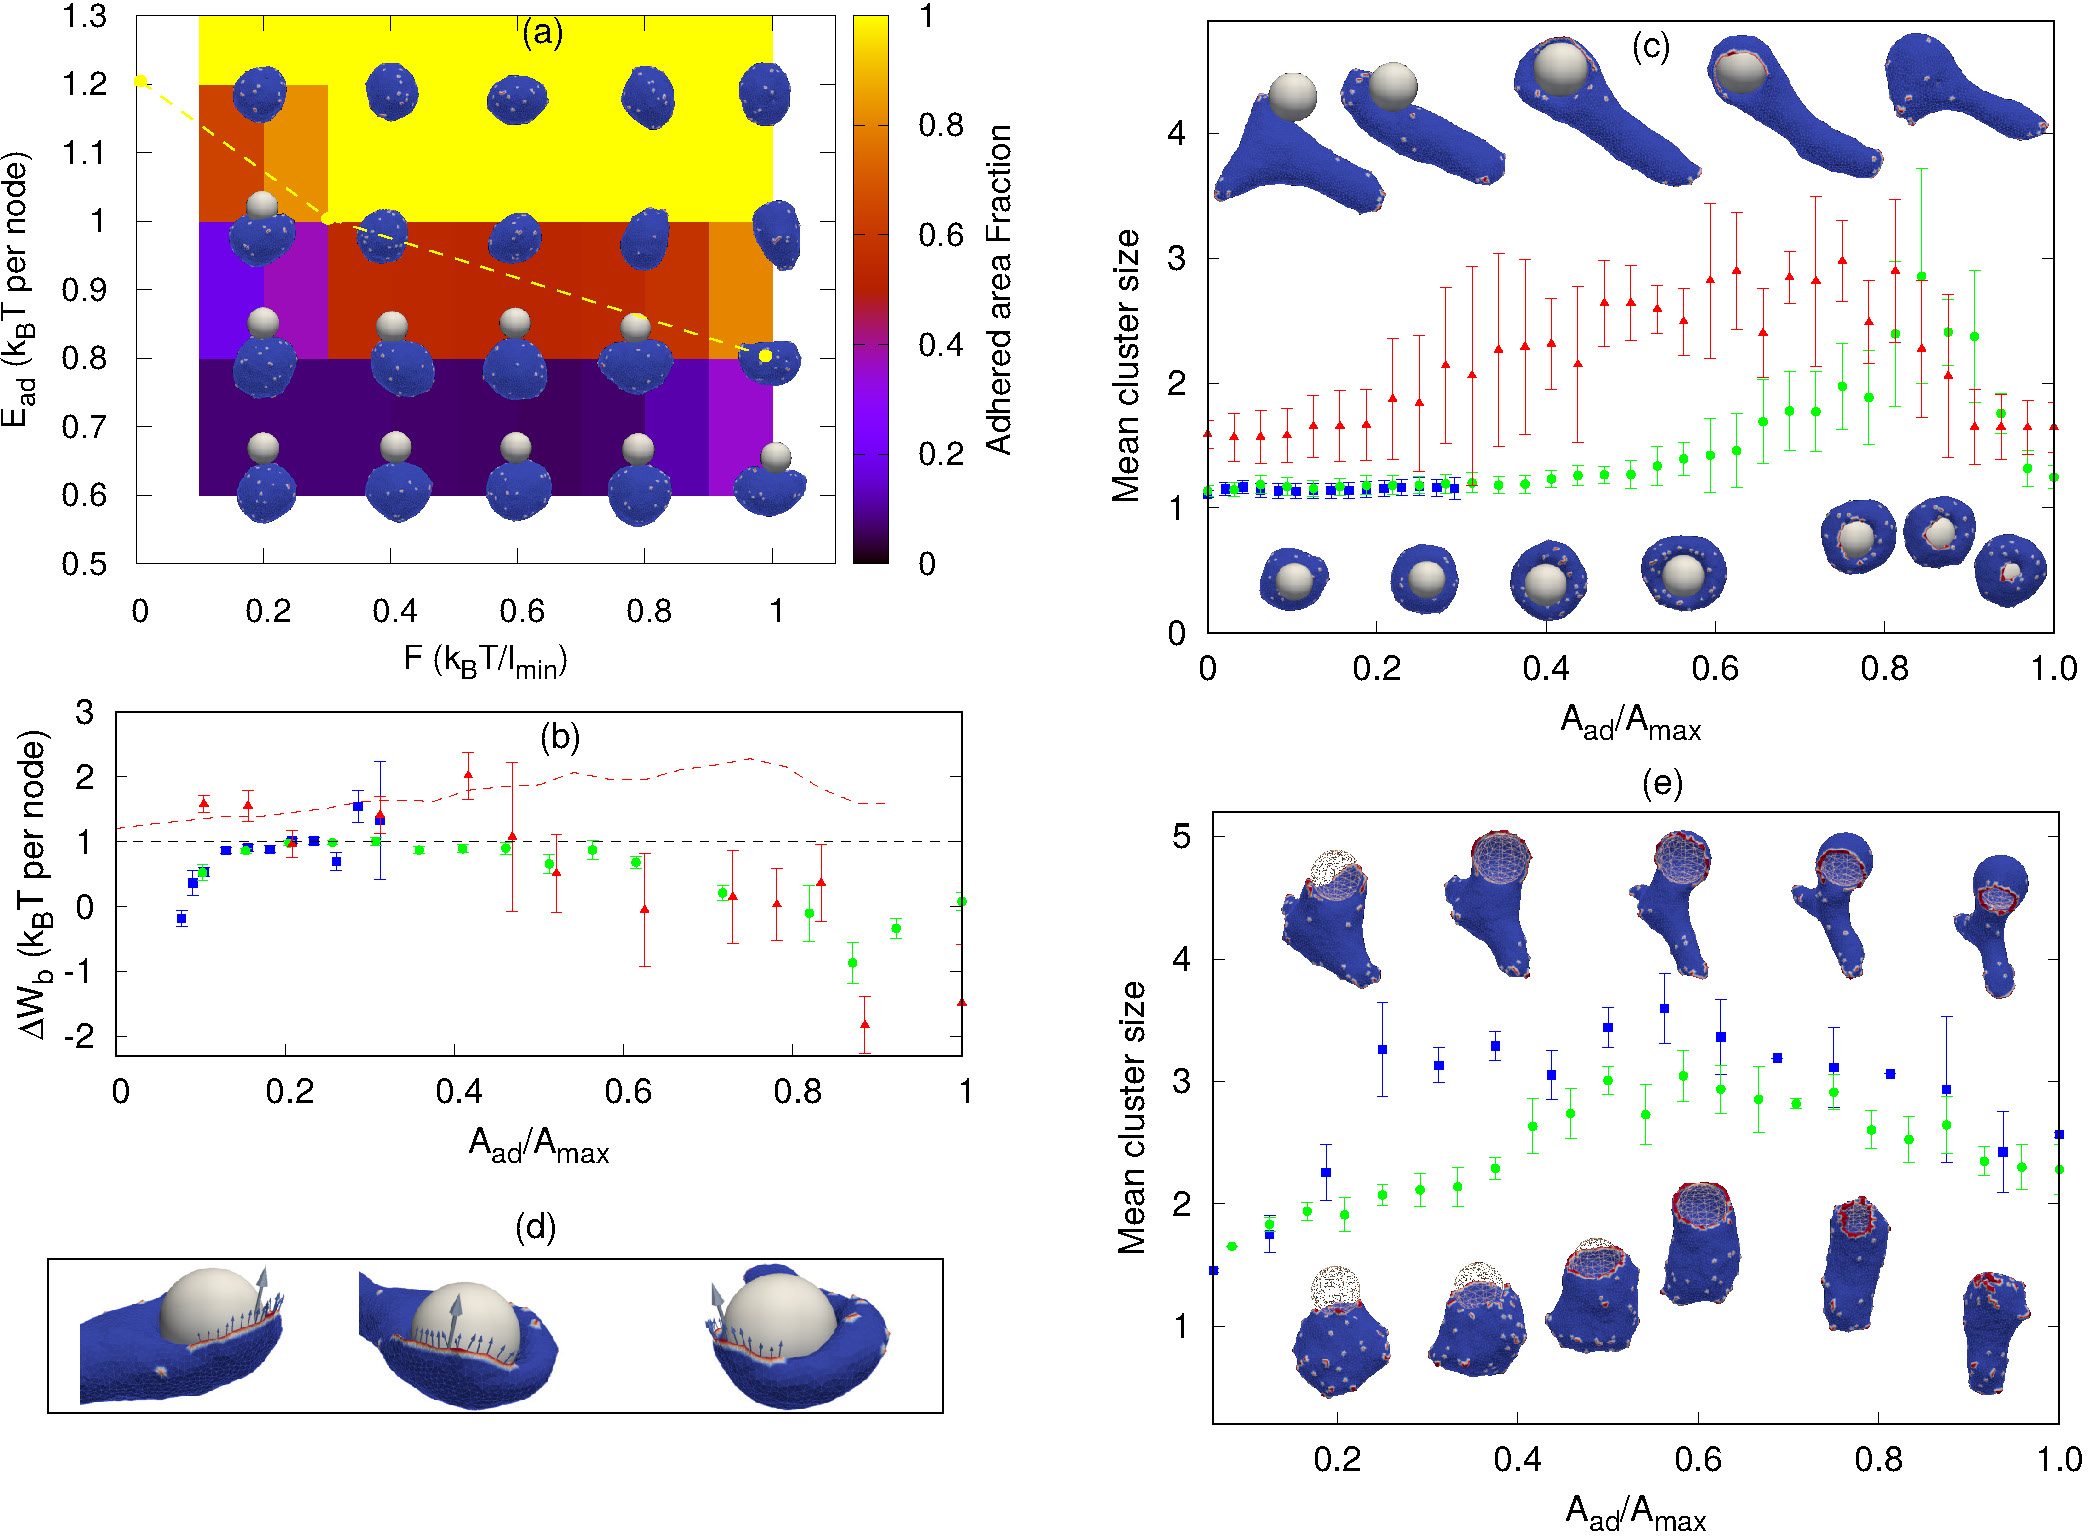
Fig. 3.

Sphere engulfment by a vesicle with active proteins. (a) Phase diagram in the Ead − F plane for a low concentration of curved proteins ρ = 1.6%, where F represents the protrusive force due to actin polymerization that is coupled with the curved membrane proteins. Background color is showing the adhered area fraction. The dashed yellow line approximately separates the fully engulfed (above the line) from the partially-engulfed states. The snapshots are shown for Ead = 0.60, 0.80, 1.0, 1.20 (in units of kBT) and F = 0.20, 0.40, 0.60, 0.80, 1.0 (in units of kBT/lmin). (b) Comparison of bending energy cost with the adhesion energy gain (both having units of kBT per adhered node) for different values of F. The blue boxes, green circles and the red triangles are for F = 0.1, 0.4 and 2 (in units of kBT/lmin) respectively. The red dashed line is showing the combined effective energy gain per adhered node, including the adhesion and the work done by the active forces (for F = 2 kBT/lmin). (c) The mean cluster size as a function of engulfed area fraction, for the same cases shown in (b) (same color code). Lower snap-shots correspond to F = 0.1, 0.4, and top snap-shots to F = 2. (d) Snap-shots of the vesicle (F = 2 kBT/lmin) indicating the contribution of the active forces to the the engulfment. Arrows show the tangential component of the individual forces (small arrows), and the direction of the total force (large arrow), for proteins that are close to the spherical surface. For (b-d), we use Ead = 1 kBT and ρ = 1.6 %. (e) Mean cluster size for large Ead and ρ. Green circles are for ρ = 6.4%, F = 1.0 kBT/lmin, and blue boxes are for ρ = 4.8 %, F = 2.0 kBT/lmin. We use Ead = 1.5 kBT for both the cases.
