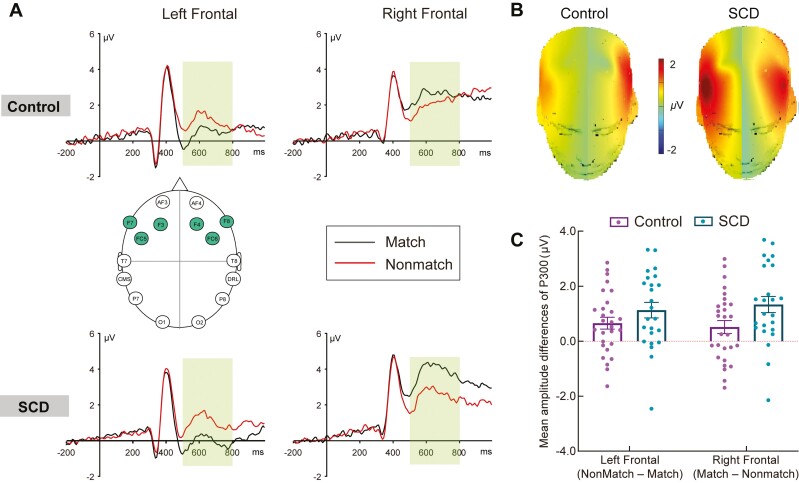
Figure 3.
Working memory–related potentials in the Control and SCD groups. Notes: Panel A shows the grand average waveforms elicited by correctly classified match and nonmatch objects in the left and right frontal regions in the Control and SCD groups, showing from −200 to 1,000 milliseconds. The left frontal region represents collapsed activity across F3, F7, and FC5, and the right frontal region represents collapsed activity across F4, F8, and FC6. The selected electrode sites are indicated by the inserted montage. The scale bars indicate the time windows used for the statistical analyses (500–800 milliseconds). The positive voltages are plotted upwards. Panel B shows the topographic maps of P300 match/nonmatch ERP effects (left: nonmatch minus match; right: match minus nonmatch) for the Control and SCD groups. The scale bar shows the amplitude range. Panel C shows the mean amplitudes of P300 match/nonmatch ERP effects (left: nonmatch minus match; right: match minus nonmatch) in the left and right frontal regions (500–800 milliseconds), which represent collapsed activity over three frontal electrodes separately for the Control and SCD groups. The error bars represent the standard error of the mean. ERP = event-related potentials; SCD = subjective cognitive decline.

