
Figure 2. IFN-γ levels under hyperglycemic conditions.
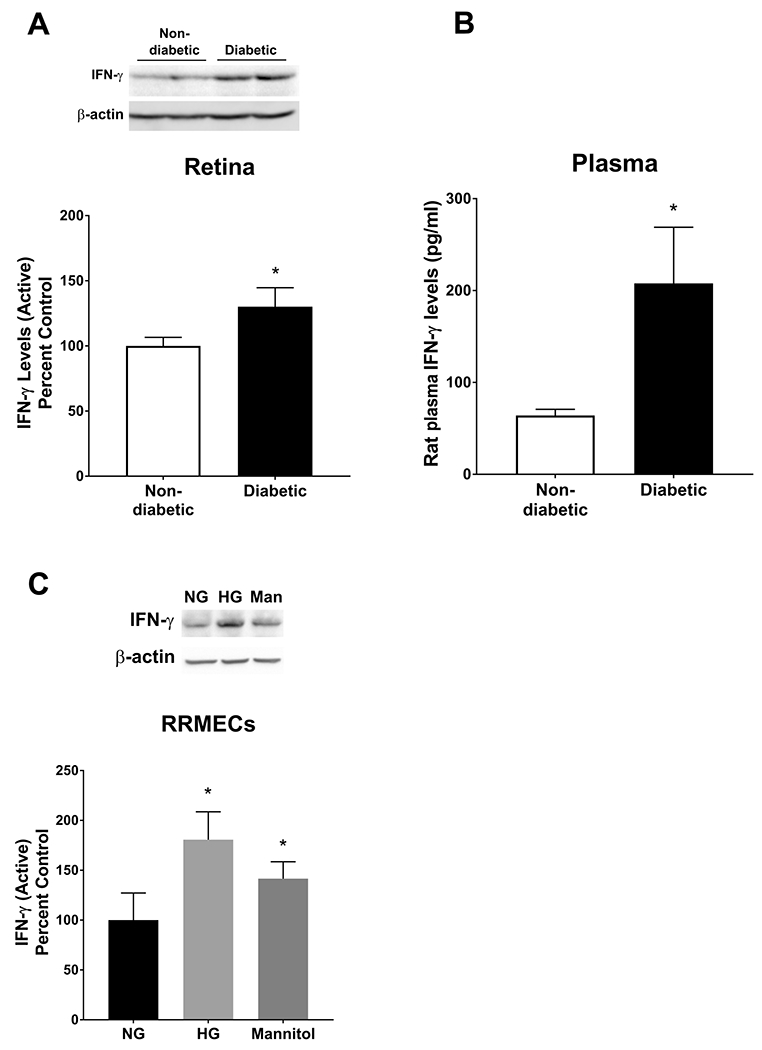
IFN-γ levels were significantly increased in retinas and plasma collected from diabetic rats (A, B) and in RRMECs grown under hyperglycemic conditions (HG) and mannitol (Man) (C) when compared to controls. Western blotting data is a comparison of the relative IFN-γ/β-actin band densities. *p<0.05, N=5-7 per group in vivo and N=3-6 per group in vitro.