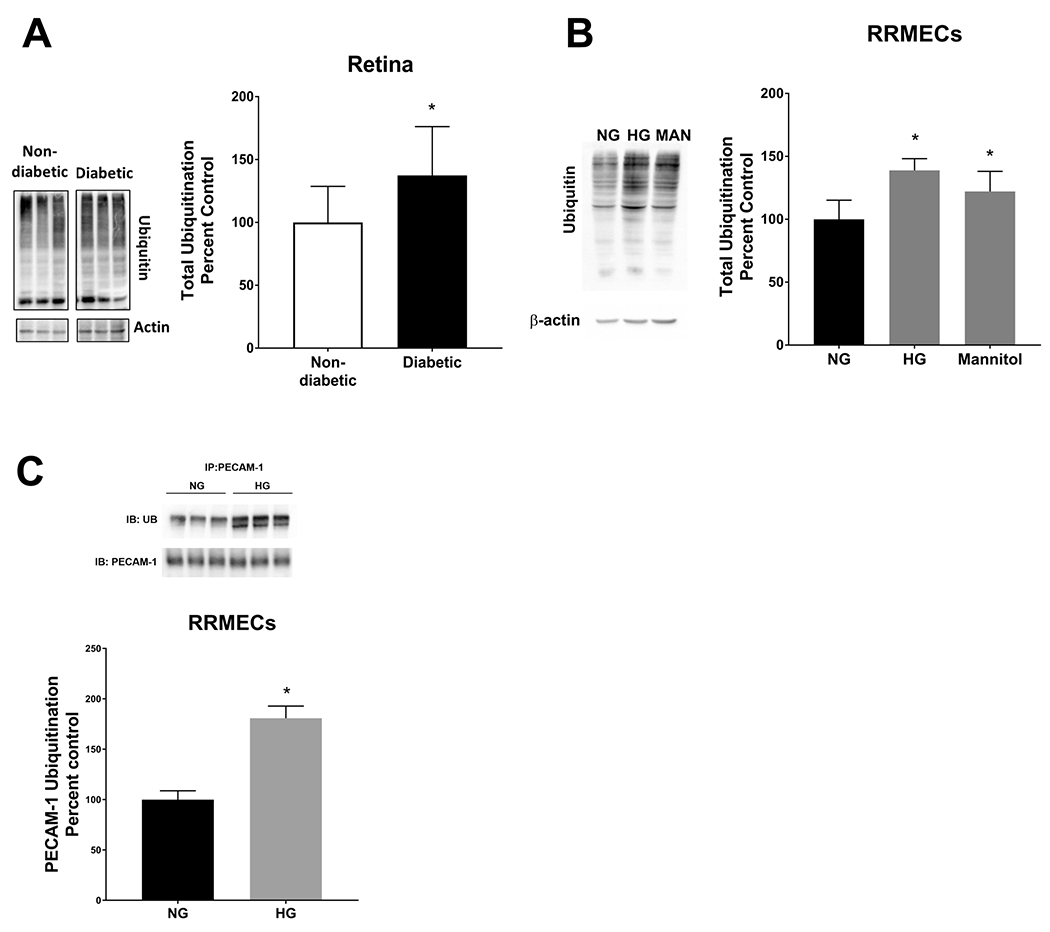
Figure 6. Total ubiquitination and PECAM-1 ubiquitination levels were significantly increased under hyperglycemic conditions.

Western blot analyses showed a significant increase in total ubiquitination levels in the retina (A) and RRMECs (B) under hyperglycemic conditions and mannitol (Man) when compared to cells grown under normoglycemic (NG) conditions. C) PECAM-1 ubiquitination levels were significantly increased in RRMECs grown under hyperglycemic (HG). Western blotting data is a comparison of the relative ubiquitin/β-actin band densities. *p<0.05, N=11-12 per group in vivo and N=3-6 per group in vitro.
