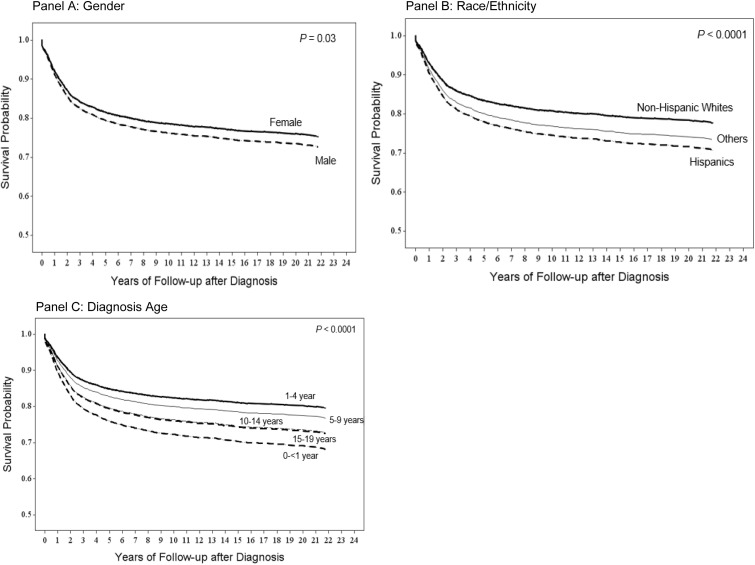
Fig 1. South Texas childhood cancer multivariable-adjusted Kaplan-Meier survival curves by gender, race/ethnicity, and diagnosis age.
(A) Survival curves stratified by gender with the adjustment of race/ethnicity (2 groups: Hispanic and non-Hispanic whites) and diagnosis age (5 groups: <1 year, 1–4 years, 5–9 years, 10–14 years, and 15–19 years). (B) Survival curves in different races/ethnicities with the adjustment of gender (2 groups: male and female) and diagnosis age (5 groups: <1 year, 1–4 years, 5–9 years, 10–14 years, and 15–19 years). (C) Survival curves in different diagnosis age groups with the adjustment of gender (2 groups: Hispanic and non-Hispanic whites) and race/ethnicity (2 groups: Hispanic and non-Hispanic whites).

