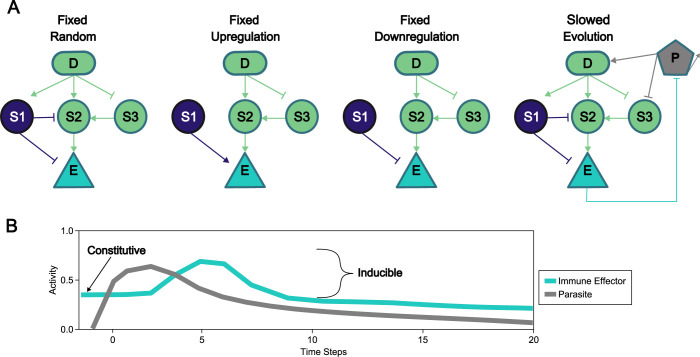
Fig 1. Examples of initial networks and within-host activity over time.
A parasite (grey) is shown infecting the Slow Evolution network (A), where it self-replicates, activates the detector, downregulates signaling protein 3, and is destroyed by the effector. D = detector, S = signaling protein, E = effector, P = Parasite. Indigo nodes and arrows show connections fixed via pleiotropic action. Example infection where the infected host employs a mixed immune response (B), shown by the presence of immune effectors before the infection begins and by the increase in effector abundance following infection.

